MoneyGram 2010 Annual Report Download - page 150
Download and view the complete annual report
Please find page 150 of the 2010 MoneyGram annual report below. You can navigate through the pages in the report by either clicking on the pages listed below, or by using the keyword search tool below to find specific information within the annual report.-
 1
1 -
2
-
3
-
4
-
5
-
6
-
7
-
8
-
9
-
10
-
11
-
12
-
13
-
14
-
15
-
16
-
17
-
18
-
19
-
20
-
21
-
22
-
23
-
24
-
25
-
26
-
27
-
28
-
29
-
30
-
31
-
32
-
33
-
34
-
35
-
36
-
37
-
38
-
39
-
40
-
41
-
42
-
43
-
44
-
45
-
46
-
47
-
48
-
49
-
50
-
51
-
52
-
53
-
54
-
55
-
56
-
57
-
58
-
59
-
60
-
61
-
62
-
63
-
64
-
65
-
66
-
67
-
68
-
69
-
70
-
71
-
72
-
73
-
74
-
75
-
76
-
77
-
78
-
79
-
80
-
81
-
82
-
83
-
84
-
85
-
86
-
87
-
88
-
89
-
90
-
91
-
92
-
93
-
94
-
95
-
96
-
97
-
98
-
99
-
100
-
101
-
102
-
103
-
104
-
105
-
106
-
107
-
108
-
109
-
110
-
111
-
112
-
113
-
114
-
115
-
116
-
117
-
118
-
119
-
120
-
121
-
122
-
123
-
124
-
125
-
126
-
127
-
128
-
129
-
130
-
131
-
132
-
133
-
134
-
135
-
136
-
137
-
138
-
139
-
 140
140 -
 141
141 -
 142
142 -
 143
143 -
 144
144 -
 145
145 -
 146
146 -
 147
147 -
 148
148 -
 149
149 -
 150
150 -
 151
151 -
 152
152 -
 153
153 -
 154
154 -
 155
155 -
 156
156 -
 157
157 -
 158
158
 |
 |
Table of Contents
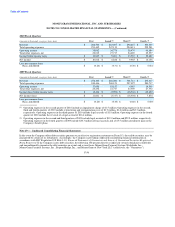
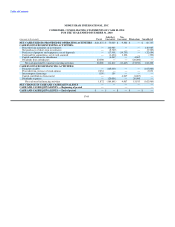
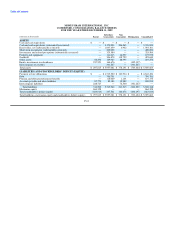
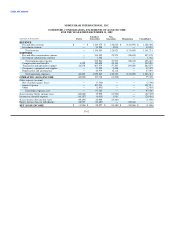
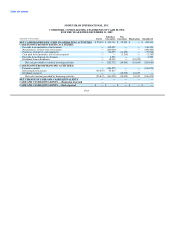
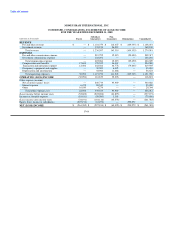
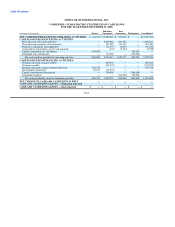
MONEYGRAM INTERNATIONAL, INC.
CONDENSED, CONSOLIDATING STATEMENTS OF CASH FLOWS
FOR THE YEAR ENDED DECEMBER 31, 2008
Subsidiary Non-
(Amounts in thousands) Parent Guarantors Guarantors Eliminations Consolidated
NET CASH PROVIDED USED IN OPERATING ACTIVITIES $ (46,315) $ (3,880,047) $ (713,419) $ — $ (4,639,781)
CASH FLOWS FROM INVESTING ACTIVITIES:
Proceeds from sales of investments — 2,004,482 891,529 — 2,896,011
Proceeds from maturities of investments — 351,983 141,337 — 493,320
Purchases of property and equipment — (31,537) (6,933) — (38,470)
Cash paid for acquisitions, net of cash acquired — (474) (2,454) — (2,928)
Capital contributions to subsidiaries (760,000) 760,000 —
Dividends from subsidiaries — 310,060 — (310,060) —
Net cash (used in) provided by investing activities (760,000) 2,634,514 1,023,479 449,940 3,347,933
CASH FLOWS FROM FINANCING ACTIVITIES:
Net proceeds from issuance of debt — 685,945 — — 685,945
Payments on debt — (101,875) — — (101,875)
Net proceeds from issuance of preferred stock 707,778 — — — 707,778
Intercompany financings 98,537 (98,537) — — —
Capital contributions from parent — 760,000 — (760,000) —
Dividends to parent — — (310,060) 310,060 —
Net cash provided by (used in) financing activities 806,315 1,245,533 (310,060) (449,940) 1,291,848
NET CHANGE IN CASH AND CASH EQUIVALENTS — — — — —
CASH AND CASH EQUIVALENTS — Beginning of period — — —
CASH AND CASH EQUIVALENTS — End of period $ — $ — $ — $ — $ —
F-65