MoneyGram 2010 Annual Report Download - page 54
Download and view the complete annual report
Please find page 54 of the 2010 MoneyGram annual report below. You can navigate through the pages in the report by either clicking on the pages listed below, or by using the keyword search tool below to find specific information within the annual report.-
 1
1 -
2
-
3
-
4
-
5
-
6
-
7
-
8
-
9
-
10
-
11
-
12
-
13
-
14
-
15
-
16
-
17
-
18
-
19
-
20
-
21
-
22
-
23
-
24
-
25
-
26
-
27
-
28
-
29
-
30
-
31
-
32
-
33
-
34
-
35
-
36
-
37
-
38
-
39
-
40
-
41
-
42
-
43
-
 44
44 -
 45
45 -
 46
46 -
 47
47 -
 48
48 -
 49
49 -
 50
50 -
 51
51 -
 52
52 -
 53
53 -
 54
54 -
 55
55 -
 56
56 -
 57
57 -
 58
58 -
 59
59 -
 60
60 -
 61
61 -
 62
62 -
 63
63 -
 64
64 -
65
-
66
-
67
-
68
-
69
-
70
-
71
-
72
-
73
-
74
-
75
-
76
-
77
-
78
-
79
-
80
-
81
-
82
-
83
-
84
-
85
-
86
-
87
-
88
-
89
-
90
-
91
-
92
-
93
-
94
-
95
-
96
-
97
-
98
-
99
-
100
-
101
-
102
-
103
-
104
-
105
-
106
-
107
-
108
-
109
-
110
-
111
-
112
-
113
-
114
-
115
-
116
-
117
-
118
-
119
-
120
-
121
-
122
-
123
-
124
-
125
-
126
-
127
-
128
-
129
-
130
-
131
-
132
-
133
-
134
-
135
-
136
-
137
-
138
-
139
-
140
-
141
-
142
-
143
-
144
-
145
-
146
-
147
-
148
-
149
-
150
-
151
-
152
-
153
-
154
-
155
-
156
-
157
-
158
 |
 |

Table of Contents
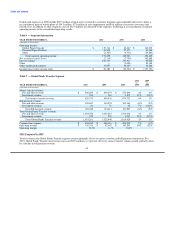
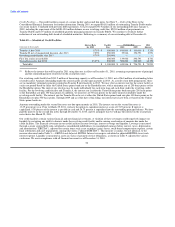
Cash and Cash Equivalents and Short-term Investments — To ensure we maintain adequate liquidity to meet our operating needs at all
times, we keep a significant portion of our investment portfolio in cash and cash equivalents and short-term investments at financial
institutions rated Aa3 or better by Moody's Investor Service ("Moody's") and AA- or better by Standard & Poors ("S&P"), and in U.S.
government money market funds rated Aaa by Moody's and AAA by S&P. As of December 31, 2010, cash and equivalents and short-
term investments totaled $3.3 billion, representing 95 percent of our total investment portfolio. Cash equivalents and short-term
investments consist of money market funds that invest in United States government and government agency securities, time deposits and
certificates of deposit.
Clearing and Cash Management Banks — We move and receive money through a network of clearing and cash management banks. The
relationships with these clearing banks and cash management banks are a critical component of our ability to move monies on a global
and timely basis. We have agreements with nine clearing banks that provide clearing and processing functions for official checks, money
orders and other draft instruments. We have eight official check clearing banks, of which five banks are currently operating under post-
termination arrangements of their contracts. The remaining three active banks provide sufficient capacity for our official check business.
We rely on two banks to clear our retail money orders and believe that these banks provide sufficient capacity for that business. One
clearing bank contract has financial covenants that include the maintenance of total cash, cash equivalents, receivables and investments in
an amount at least equal to total outstanding payment service obligations, as well as the maintenance of a minimum 103 percent ratio of
total assets held at that bank to instruments estimated to clear through that bank. Financial covenants related to special purpose entities
("SPEs") include the maintenance of specified ratios of greater than 100 percent of cash, cash equivalents and investments held in the
SPE to outstanding payment instruments issued by the related financial institution.
We also maintain contractual relationships with a variety of domestic and international cash management banks for ACH and wire
transfer services used in the movement of consumer funds and agent settlements. There are a limited number of international cash
management banks with a network large enough to manage cash settlements for our entire agent base, and some of these large
international banks have opted not to bank money service businesses. As a result, we also utilize regional or country-based banking
partners in addition to large cash management banks.
Special Purpose Entities — For certain of our financial institution customers, we established individual SPEs upon the origination of our
relationship. Along with operational processes and certain financial covenants, these SPEs provide the financial institutions with
additional assurance of our ability to clear their official checks. Under these relationships, the investment portfolio assets and payment
service obligations related to the financial institution customer are all held by the SPE. In most cases, the fair value of the investment
portfolio must be maintained in excess of the payment service obligations. As the related financial institution customer sells our payment
service instruments, the principal amount of the instrument and any fees are paid into the SPE. As payment service instruments issued by
the financial institution customer are presented for payment, the cash and cash equivalents within the SPE are used to settle the
instrument. As a result, cash and cash equivalents within SPEs are generally not available for use outside of the SPE. We remain liable to
satisfy the obligations, both contractually and under the Uniform Commercial Code, as the issuer and drawer of the official checks
regardless of the existence of the SPEs. Accordingly, we consolidate all of the assets and liabilities of these SPEs in our Consolidated
Balance Sheets, with the individual assets and liabilities of the SPEs classified in a manner similar to our other assets and liabilities.
Under limited circumstances, the financial institution customers that are beneficiaries of the SPEs have the right to either demand
liquidation of the assets in the SPEs or to replace us as the administrator of the SPE. Such limited circumstances consist of material, and
in most cases continued, failure to uphold our warranties and obligations pursuant to the underlying agreements with the financial
institutions.
The combined SPEs hold 2 percent of our $3.4 billion portfolio as of December 31, 2010, as compared to 3 percent at December 31,
2009. As the SPEs relate to financial institution customers we terminated in connection with the restructuring of our official check
business, we expect the SPEs to continue to decline as a percentage of our portfolio as the outstanding instruments related to the financial
institutions roll-off.
51