MoneyGram 2010 Annual Report Download - page 37
Download and view the complete annual report
Please find page 37 of the 2010 MoneyGram annual report below. You can navigate through the pages in the report by either clicking on the pages listed below, or by using the keyword search tool below to find specific information within the annual report.-
 1
1 -
2
-
3
-
4
-
5
-
6
-
7
-
8
-
9
-
10
-
11
-
12
-
13
-
14
-
15
-
16
-
17
-
18
-
19
-
20
-
21
-
22
-
23
-
24
-
25
-
26
-
 27
27 -
 28
28 -
 29
29 -
 30
30 -
 31
31 -
 32
32 -
 33
33 -
 34
34 -
 35
35 -
 36
36 -
 37
37 -
 38
38 -
 39
39 -
 40
40 -
 41
41 -
 42
42 -
 43
43 -
 44
44 -
 45
45 -
 46
46 -
 47
47 -
48
-
49
-
50
-
51
-
52
-
53
-
54
-
55
-
56
-
57
-
58
-
59
-
60
-
61
-
62
-
63
-
64
-
65
-
66
-
67
-
68
-
69
-
70
-
71
-
72
-
73
-
74
-
75
-
76
-
77
-
78
-
79
-
80
-
81
-
82
-
83
-
84
-
85
-
86
-
87
-
88
-
89
-
90
-
91
-
92
-
93
-
94
-
95
-
96
-
97
-
98
-
99
-
100
-
101
-
102
-
103
-
104
-
105
-
106
-
107
-
108
-
109
-
110
-
111
-
112
-
113
-
114
-
115
-
116
-
117
-
118
-
119
-
120
-
121
-
122
-
123
-
124
-
125
-
126
-
127
-
128
-
129
-
130
-
131
-
132
-
133
-
134
-
135
-
136
-
137
-
138
-
139
-
140
-
141
-
142
-
143
-
144
-
145
-
146
-
147
-
148
-
149
-
150
-
151
-
152
-
153
-
154
-
155
-
156
-
157
-
158
 |
 |

Table of Contents
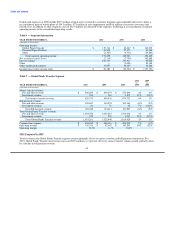
• Total commissions expense increased $3.0 million, or 1 percent, in 2010 due to money transfer volume growth, partially offset by a
decline in the euro exchange rate, lower average commission rates and lower commissions expense related to the Financial Paper
Products segment and bill payment products.
• Total operating expenses decreased $78.1 million, or 7 percent, in 2010. Expenses in 2009 included $54.8 million of legal reserves
relating to securities litigation, stockholder derivative claims, a patent lawsuit and a settlement with the Federal Trade Commission;
goodwill and asset impairments of $18.3 million; $15.0 million of incremental provision for loss, primarily from the closure of an
international agent; a $14.3 million net curtailment gain on benefit plans; $6.4 million of costs related to the implementation of the
European Union Payment Services Directive; and $4.4 million of executive severance and related costs. Expenses in 2010 included
a $16.4 million reversal of a patent lawsuit accrual, $5.9 million of costs associated with our global transformation initiative and
$1.8 million of asset impairments. In 2010, employee stock-based compensation increased $11.2 million, marketing costs increased
$6.9 million and incentive compensation increased $1.6 million, while depreciation and amortization expense decreased
$9.0 million.
• Net securities gains of $2.1 million in 2010 reflect a $2.4 million net gain from the call of a trading investment, partially offset by
$0.3 million of other-than-temporary impairments on other asset-backed securities. This is compared to net securities gains of
$7.8 million in 2009, which reflected a $7.6 million net gain from the call of two trading investments and valuation gains of
$4.3 million on the put option related to the remaining trading investment, partially offset by $4.1 million of other-than-temporary
impairments on other asset-backed securities.
• Interest expense decreased 5 percent to $102.1 million in 2010 from $107.9 million in 2009, reflecting lower outstanding debt
balances due to repayments of debt, partially offset by the $8.6 million pro-rata write-off of deferred financing costs and debt
discount related to the $165.0 million of debt prepayments during 2010.
• We had income tax expense of $14.6 million on pre-tax income of $58.4 million in 2010, reflecting a release of $11.9 million of
valuation allowances on U.S. deferred tax assets primarily due to reversals and payments of 2009 legal reserves.
• The decline in the euro exchange rate decreased total revenue by $18.1 million and total expenses by $15.1 million, for a net
decrease to our income before income taxes of $3.0 million.
Following is a summary of significant actions taken by the Company and economic conditions during the year that impacted our
operating results in 2010:
Global Economic Conditions — Throughout 2010, worldwide economic conditions continued to remain weak, as evidenced by high
unemployment rates, government assistance to citizens and businesses on a global basis, continued declines in asset values, restricted
lending activity and low consumer confidence, among other factors. Historically, the money remittance industry has generally been
resilient during times of economic softness as money transfers are deemed essential to many, with the funds used by the receiving party
for food, housing and other basic needs. However, given the global reach and extent of the current economic recession, the growth of
money transfer volumes and the average principal of money transfers continued to fluctuate by corridor and country in 2010. In addition,
bill payment products available in the United States are not as resilient as money transfers given the more discretionary nature of some
items paid for by consumers using these products. Accordingly, the volume of bill payment transactions continued to be adversely
impacted in 2010, particularly in the auto, housing and credit card sectors. While there have been some indicators of moderation and
improvement throughout 2010, particularly in the United States, we continue to have limited visibility into the future and believe growth
rates will continue to be hampered in 2011.
34