MoneyGram 2010 Annual Report Download - page 144
Download and view the complete annual report
Please find page 144 of the 2010 MoneyGram annual report below. You can navigate through the pages in the report by either clicking on the pages listed below, or by using the keyword search tool below to find specific information within the annual report.-
 1
1 -
2
-
3
-
4
-
5
-
6
-
7
-
8
-
9
-
10
-
11
-
12
-
13
-
14
-
15
-
16
-
17
-
18
-
19
-
20
-
21
-
22
-
23
-
24
-
25
-
26
-
27
-
28
-
29
-
30
-
31
-
32
-
33
-
34
-
35
-
36
-
37
-
38
-
39
-
40
-
41
-
42
-
43
-
44
-
45
-
46
-
47
-
48
-
49
-
50
-
51
-
52
-
53
-
54
-
55
-
56
-
57
-
58
-
59
-
60
-
61
-
62
-
63
-
64
-
65
-
66
-
67
-
68
-
69
-
70
-
71
-
72
-
73
-
74
-
75
-
76
-
77
-
78
-
79
-
80
-
81
-
82
-
83
-
84
-
85
-
86
-
87
-
88
-
89
-
90
-
91
-
92
-
93
-
94
-
95
-
96
-
97
-
98
-
99
-
100
-
101
-
102
-
103
-
104
-
105
-
106
-
107
-
108
-
109
-
110
-
111
-
112
-
113
-
114
-
115
-
116
-
117
-
118
-
119
-
120
-
121
-
122
-
123
-
124
-
125
-
126
-
127
-
128
-
129
-
130
-
131
-
132
-
133
-
 134
134 -
 135
135 -
 136
136 -
 137
137 -
 138
138 -
 139
139 -
 140
140 -
 141
141 -
 142
142 -
 143
143 -
 144
144 -
 145
145 -
 146
146 -
 147
147 -
 148
148 -
 149
149 -
 150
150 -
 151
151 -
 152
152 -
 153
153 -
 154
154 -
155
-
156
-
157
-
158
 |
 |

Table of Contents
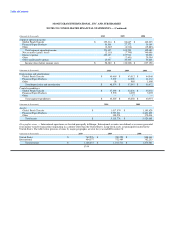
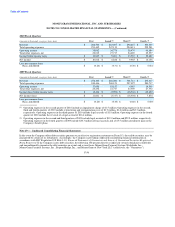
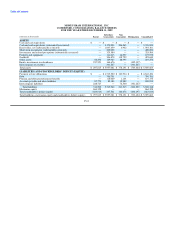
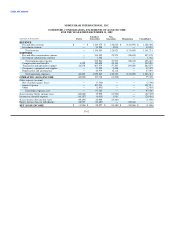
MONEYGRAM INTERNATIONAL, INC.
CONDENSED, CONSOLIDATING STATEMENTS OF INCOME(LOSS)
FOR THE YEAR ENDED DECEMBER 31, 2010
Subsidiary Non-
(Amounts in thousands) Parent Guarantors Guarantors Eliminations Consolidated
REVENUE
Fee and other revenue $ — $ 1,125,014 $ 204,267 $ (183,969) $ 1,145,312
Investment revenue — 21,080 261 — 21,341
Total revenue — 1,146,094 204,528 (183,969) 1,166,653
EXPENSES
Fee and other commissions expense — 527,539 91,647 (118,427) 500,759
Investment commissions expense — 737 — — 737
Total commissions expense — 528,276 91,647 (118,427) 501,496
Compensation and benefits (217) 175,521 51,118 — 226,422
Transaction and operations support 1,564 208,966 40,794 (65,542) 185,782
Occupancy, equipment and supplies — 36,987 9,494 — 46,481
Depreciation and amortization — 37,412 10,662 — 48,074
Total operating expenses 1,347 987,162 203,715 (183,969) 1,008,255
OPERATING (LOSS) INCOME (1,347) 158,932 813 — 158,398
Other expense (income)
Net securities (gains) losses — (2,115) — — (2,115)
Interest expense — 102,133 — — 102,133
Other — — — — —
Total other expenses, net — 100,018 — — 100,018
(Loss) income before income taxes (1,347) 58,914 813 — 58,380
Income tax (benefit) expense (471) 11,113 3,937 — 14,579
(Loss) income after income taxes (876) 47,801 (3,124) — 43,801
Equity income (loss) in subsidiaries 44,677 (3,124) — (41,553) —
NET INCOME(LOSS) $ 43,801 $ 44,677 $ (3,124) $ (41,553) $ 43,801
F-59