MoneyGram 2010 Annual Report Download - page 90
Download and view the complete annual report
Please find page 90 of the 2010 MoneyGram annual report below. You can navigate through the pages in the report by either clicking on the pages listed below, or by using the keyword search tool below to find specific information within the annual report.-
 1
1 -
2
-
3
-
4
-
5
-
6
-
7
-
8
-
9
-
10
-
11
-
12
-
13
-
14
-
15
-
16
-
17
-
18
-
19
-
20
-
21
-
22
-
23
-
24
-
25
-
26
-
27
-
28
-
29
-
30
-
31
-
32
-
33
-
34
-
35
-
36
-
37
-
38
-
39
-
40
-
41
-
42
-
43
-
44
-
45
-
46
-
47
-
48
-
49
-
50
-
51
-
52
-
53
-
54
-
55
-
56
-
57
-
58
-
59
-
60
-
61
-
62
-
63
-
64
-
65
-
66
-
67
-
68
-
69
-
70
-
71
-
72
-
73
-
74
-
75
-
76
-
77
-
78
-
79
-
 80
80 -
 81
81 -
 82
82 -
 83
83 -
 84
84 -
 85
85 -
 86
86 -
 87
87 -
 88
88 -
 89
89 -
 90
90 -
 91
91 -
 92
92 -
 93
93 -
 94
94 -
 95
95 -
 96
96 -
 97
97 -
 98
98 -
 99
99 -
 100
100 -
101
-
102
-
103
-
104
-
105
-
106
-
107
-
108
-
109
-
110
-
111
-
112
-
113
-
114
-
115
-
116
-
117
-
118
-
119
-
120
-
121
-
122
-
123
-
124
-
125
-
126
-
127
-
128
-
129
-
130
-
131
-
132
-
133
-
134
-
135
-
136
-
137
-
138
-
139
-
140
-
141
-
142
-
143
-
144
-
145
-
146
-
147
-
148
-
149
-
150
-
151
-
152
-
153
-
154
-
155
-
156
-
157
-
158
 |
 |
Table of Contents
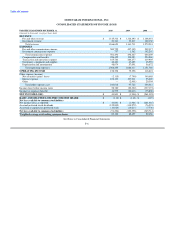
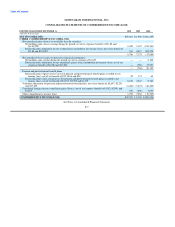
MONEYGRAM INTERNATIONAL, INC.
CONSOLIDATED BALANCE SHEETS
AT DECEMBER 31, 2010 2009
(Amounts in thousands, except share data)
ASSETS
Cash and cash equivalents $ — $ —
Cash and cash equivalents (substantially restricted) 2,865,941 3,376,824
Receivables, net (substantially restricted) 982,319 1,054,381
Short-term investments (substantially restricted) 405,769 400,000
Trading investments and related put options (substantially restricted) — 26,951
Available-for-sale investments (substantially restricted) 160,936 298,633
Property and equipment 115,111 127,972
Goodwill 428,691 425,630
Other assets 156,969 219,272
Total assets $5,115,736 $5,929,663
LIABILITIES
Payment service obligations $4,184,736 $4,843,454
Debt 639,946 796,791
Pension and other postretirement benefits 120,536 119,170
Accounts payable and other liabilities 113,647 188,933
Total liabilities 5,058,865 5,948,348
COMMITMENTS AND CONTINGENCIES (NOTE 15)
MEZZANINE EQUITY
Participating Convertible Preferred Stock-Series B, $0.01 par value, 760,000 shares authorized, 495,000 shares
issued and outstanding 628,199 539,084
Participating Convertible Preferred Stock-Series B-1, $0.01 par value, 500,000 shares authorized,
272,500 shares issued and outstanding 371,154 325,244
Total mezzanine equity 999,353 864,328
STOCKHOLDERS' DEFICIT
Preferred shares, $0.01 par value, none issued — —
Common shares, $0.01 par value, 1,300,000,000 shares authorized, 88,556,077 shares issued 886 886
Additional paid-in capital — —
Retained loss (771,544) (694,914)
Unearned employee benefits — (8)
Accumulated other comprehensive loss (31,879) (35,671)
Treasury stock: 4,935,555 and 6,040,958 shares in 2010 and 2009 (139,945) (153,306)
Total stockholders' deficit (942,482) (883,013)
Total liabilities, mezzanine equity and stockholders' deficit $5,115,736 $5,929,663
See Notes to Consolidated Financial Statements
F-5