MoneyGram 2010 Annual Report Download - page 38
Download and view the complete annual report
Please find page 38 of the 2010 MoneyGram annual report below. You can navigate through the pages in the report by either clicking on the pages listed below, or by using the keyword search tool below to find specific information within the annual report.-
 1
1 -
2
-
3
-
4
-
5
-
6
-
7
-
8
-
9
-
10
-
11
-
12
-
13
-
14
-
15
-
16
-
17
-
18
-
19
-
20
-
21
-
22
-
23
-
24
-
25
-
26
-
27
-
 28
28 -
 29
29 -
 30
30 -
 31
31 -
 32
32 -
 33
33 -
 34
34 -
 35
35 -
 36
36 -
 37
37 -
 38
38 -
 39
39 -
 40
40 -
 41
41 -
 42
42 -
 43
43 -
 44
44 -
 45
45 -
 46
46 -
 47
47 -
 48
48 -
49
-
50
-
51
-
52
-
53
-
54
-
55
-
56
-
57
-
58
-
59
-
60
-
61
-
62
-
63
-
64
-
65
-
66
-
67
-
68
-
69
-
70
-
71
-
72
-
73
-
74
-
75
-
76
-
77
-
78
-
79
-
80
-
81
-
82
-
83
-
84
-
85
-
86
-
87
-
88
-
89
-
90
-
91
-
92
-
93
-
94
-
95
-
96
-
97
-
98
-
99
-
100
-
101
-
102
-
103
-
104
-
105
-
106
-
107
-
108
-
109
-
110
-
111
-
112
-
113
-
114
-
115
-
116
-
117
-
118
-
119
-
120
-
121
-
122
-
123
-
124
-
125
-
126
-
127
-
128
-
129
-
130
-
131
-
132
-
133
-
134
-
135
-
136
-
137
-
138
-
139
-
140
-
141
-
142
-
143
-
144
-
145
-
146
-
147
-
148
-
149
-
150
-
151
-
152
-
153
-
154
-
155
-
156
-
157
-
158
 |
 |

Table of Contents
Interest Rate Environment — Interest rates remained low through 2010. Interest rates affect our business in several ways, but primarily
through investment revenue, investment commission expense and interest expense. First, the majority of our investment portfolio
(including cash and cash equivalents and all classes of investments) is floating rate, causing investment revenue to decrease when rates
decline and increase when rates rise. Second, the commissions we pay to our financial institution customers are variable rate, primarily
based on the effective federal funds rate. Accordingly, our investment commissions expense decreases when rates decline and increases
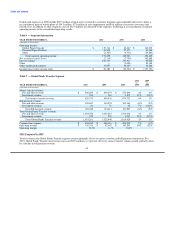
when rates rise. As discussed in Table 3 — Net Investment Revenue Analysis, our net investment margin is based on the spread between
the yield earned on our investment portfolio and the commission rates paid to our financial institution customers. In the current
environment, the federal funds rate is so low that most of our financial institution customers are in a "negative" commission position, in
that we do not owe any commissions to our customers. While the vast majority of our contracts require the financial institution customers
to pay us for the negative commission amount, we have opted at this time to impose certain per-item and other fees rather than require
payment. We continue to monitor the negative commissions and are reviewing our current fee structure for possible changes. Finally, our
senior facility is floating rate debt, and accordingly, our interest expense will decrease in a declining rate environment and increase when
rates rise.
Money Transfer Pricing — In the first half of 2010, we introduced a $50 price band that allows consumers to send $50 of principal for a
$5 fee at most locations, or a $4.75 fee at a Walmart location. In the fourth quarter of 2010, we increased advertising for our domestic
business and, in particular, promoted the new $50 price band to every MoneyGram location across the United States. As discussed further
in Table 7 — Global Funds Transfer Segment, the $50 price band impacted revenue growth during the year. As we expect the $50 price
band to be a long-term change in our pricing, we anticipate revenue growth will continue to be impacted.
Official Check Restructuring and Repricing — In the first quarter of 2008, we initiated the restructuring of our official check business by
changing the commission structure and exiting certain large customer relationships, particularly our top 10 financial institution
customers. As of December 31, 2010, approximately $2.1 billion of balances for the top 10 customers have run-off, with the remaining
balances expected to run-off as old issuances are presented to us for payment. The run-off of these balances reduced our investment
revenue in 2010. In 2008, we reduced the commission rate paid to the majority of our official check financial institution customers to
reflect the impact of the realigned investment portfolio on the profitability of this product. The repricing results in an average contractual
payout rate of the effective federal funds rate less approximately 85 basis points, and reduced our investment commissions expense. See
Table 3 — Net Investment Revenue Analysis for further discussion on the impact of our official check restructuring and repricing
initiative.
Money Order Repricing and Review — In the fourth quarter of 2008, we initiated the first phase of a repricing initiative for our money
order product sold through retail agent locations. This initiative increases the per-item fee we receive for our money orders and reflects
the impact of the realigned investment portfolio on the profitability of this product. A broader second phase of repricing was initiated in
the second quarter of 2009. In addition, we continue to review our credit exposure to our agents and may terminate or otherwise revise
our relationship with certain agents. As anticipated, money order volumes in 2009 and 2010 declined from these initiatives. While we do
not expect any further decline in money order volume due to our repricing initiatives, we do anticipate further market declines as
consumers migrate to other payment products and as consumer prices increase due to agents passing along fee increases and changes in
the general economic environment.
Global Transformation Initiative — In the second quarter of 2010, we announced that we were implementing a global transformation
initiative to realign our management and operations with the changing global market and streamline operations to promote a more
efficient and scalable cost structure. The initiative will include organizational changes, relocation of certain operations and investment in
technology, among other items. Based upon preliminary estimates, the Company anticipates incurring $45 million to $50 million of cash
outlays in future phases to generate annual pre-tax cost savings of $25 million to $30 million when fully implemented in 2012. In
connection with the first phase of this initiative, we recorded $5.9 million of expenses during 2010, with $3.0 million included in the
"Compensation and benefits" line, $1.3 million included in the "Transactions and operations support" line and $1.6 million included in
the "Occupancy, equipment and supplies" line in our Consolidated Statements of Income (Loss).
35