MoneyGram 2010 Annual Report Download - page 59
Download and view the complete annual report
Please find page 59 of the 2010 MoneyGram annual report below. You can navigate through the pages in the report by either clicking on the pages listed below, or by using the keyword search tool below to find specific information within the annual report.-
 1
1 -
2
-
3
-
4
-
5
-
6
-
7
-
8
-
9
-
10
-
11
-
12
-
13
-
14
-
15
-
16
-
17
-
18
-
19
-
20
-
21
-
22
-
23
-
24
-
25
-
26
-
27
-
28
-
29
-
30
-
31
-
32
-
33
-
34
-
35
-
36
-
37
-
38
-
39
-
40
-
41
-
42
-
43
-
44
-
45
-
46
-
47
-
48
-
 49
49 -
 50
50 -
 51
51 -
 52
52 -
 53
53 -
 54
54 -
 55
55 -
 56
56 -
 57
57 -
 58
58 -
 59
59 -
 60
60 -
 61
61 -
 62
62 -
 63
63 -
 64
64 -
 65
65 -
 66
66 -
 67
67 -
 68
68 -
 69
69 -
70
-
71
-
72
-
73
-
74
-
75
-
76
-
77
-
78
-
79
-
80
-
81
-
82
-
83
-
84
-
85
-
86
-
87
-
88
-
89
-
90
-
91
-
92
-
93
-
94
-
95
-
96
-
97
-
98
-
99
-
100
-
101
-
102
-
103
-
104
-
105
-
106
-
107
-
108
-
109
-
110
-
111
-
112
-
113
-
114
-
115
-
116
-
117
-
118
-
119
-
120
-
121
-
122
-
123
-
124
-
125
-
126
-
127
-
128
-
129
-
130
-
131
-
132
-
133
-
134
-
135
-
136
-
137
-
138
-
139
-
140
-
141
-
142
-
143
-
144
-
145
-
146
-
147
-
148
-
149
-
150
-
151
-
152
-
153
-
154
-
155
-
156
-
157
-
158
 |
 |

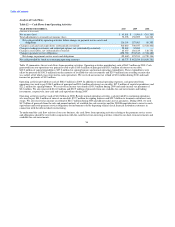
Table of Contents
Analysis of Cash Flows
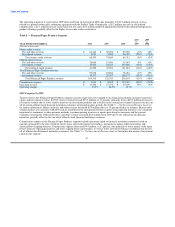
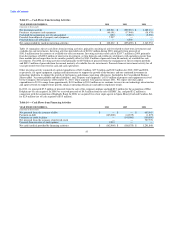
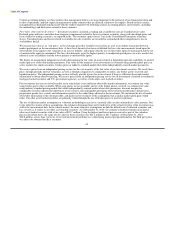
Table 12 — Cash Flows from Operating Activities
YEAR ENDED DECEMBER 31, 2010 2009 2008
(Amounts in thousands)
Net income (loss) $ 43,801 $ (1,906) $ (261,385)
Total adjustments to reconcile net income (loss) 72,398 158,909 341,740
Net cash provided by operating activities before changes in payment service assets and
obligations 116,199 157,003 80,355
Change in cash and cash equivalents (substantially restricted) 510,883 700,557 (2,524,402)
Change in trading investments and related put options, net (substantially restricted) 29,400 32,900 —
Change in receivables, net (substantially restricted) 63,037 186,619 128,752
Change in payment service obligations (658,782) (594,545) (2,324,486)
Net change in payment service assets and obligations (55,462) 325,531 (4,720,136)
Net cash provided by (used in) continuing operating activities $ 60,737 $ 482,534 $(4,639,781)
Table 12 summarizes the net cash flows from operating activities. Operating activities provided net cash of $60.7 million in 2010. Cash
generated from our operations was primarily used to pay $165.0 million of principal and $83.5 million of interest on our debt,
$40.2 million of capital expenditures, $27.2 million for signing bonuses and normal operating expenditures. These expenditures were
offset by proceeds of $141.0 million from the maturity of available-for-sale investments and $29.4 million from a trading security that
was called, all of which was reinvested in cash equivalents. We received an income tax refund of $3.8 million during 2010 and made
income tax payments of $3.9 million.
Operating activities provided net cash of $482.5 million in 2009. In addition to normal operating expenses, cash generated from
operations was used to pay $186.9 million of principal and $94.4 million of interest on our debt, $37.9 million of capital expenditures and
$22.2 million for signing bonuses. We received an income tax refund of $43.5 million during 2009 and made income tax payments of
$2.2 million. We also reinvested $141.0 million and $32.9 million of proceeds from our available-for-sale investments and trading
investments, respectively, into cash and cash equivalents during 2009.
Operating activities used net cash of $4.6 billion in 2008. Besides normal operating activities, cash provided by continuing operations
was used to pay $84.0 million of interest on our debt, $57.7 million for signing bonuses and $29.7 million to terminate our interest rate
swaps. We also received an income tax refund of $24.7 million during 2008 and did not make any tax payments. During 2008, we used
$4.7 billion of proceeds from the sale and normal maturity of available-for-sale securities and the 2008 Recapitalization to invest in cash
equivalents and settle payment service obligations for instruments sold by departing official check financial institution customers in
connection with the official check restructuring.
To understand the cash flow activity of our core business, the cash flows from operating activities relating to the payment service assets
and obligations should be reviewed in conjunction with the cash flows from investing activities related to our short-term investments and
available-for-sale investments.
56