MoneyGram 2010 Annual Report Download - page 47
Download and view the complete annual report
Please find page 47 of the 2010 MoneyGram annual report below. You can navigate through the pages in the report by either clicking on the pages listed below, or by using the keyword search tool below to find specific information within the annual report.-
 1
1 -
2
-
3
-
4
-
5
-
6
-
7
-
8
-
9
-
10
-
11
-
12
-
13
-
14
-
15
-
16
-
17
-
18
-
19
-
20
-
21
-
22
-
23
-
24
-
25
-
26
-
27
-
28
-
29
-
30
-
31
-
32
-
33
-
34
-
35
-
36
-
 37
37 -
 38
38 -
 39
39 -
 40
40 -
 41
41 -
 42
42 -
 43
43 -
 44
44 -
 45
45 -
 46
46 -
 47
47 -
 48
48 -
 49
49 -
 50
50 -
 51
51 -
 52
52 -
 53
53 -
 54
54 -
 55
55 -
 56
56 -
 57
57 -
58
-
59
-
60
-
61
-
62
-
63
-
64
-
65
-
66
-
67
-
68
-
69
-
70
-
71
-
72
-
73
-
74
-
75
-
76
-
77
-
78
-
79
-
80
-
81
-
82
-
83
-
84
-
85
-
86
-
87
-
88
-
89
-
90
-
91
-
92
-
93
-
94
-
95
-
96
-
97
-
98
-
99
-
100
-
101
-
102
-
103
-
104
-
105
-
106
-
107
-
108
-
109
-
110
-
111
-
112
-
113
-
114
-
115
-
116
-
117
-
118
-
119
-
120
-
121
-
122
-
123
-
124
-
125
-
126
-
127
-
128
-
129
-
130
-
131
-
132
-
133
-
134
-
135
-
136
-
137
-
138
-
139
-
140
-
141
-
142
-
143
-
144
-
145
-
146
-
147
-
148
-
149
-
150
-
151
-
152
-
153
-
154
-
155
-
156
-
157
-
158
 |
 |

Table of Contents
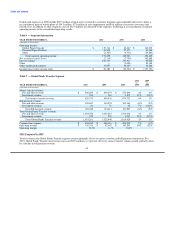
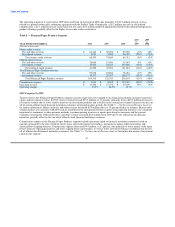
Unallocated expenses in 2009 include $20.3 million of legal reserves related to securities litigation and stockholder derivative claims, a
net curtailment gain on benefit plans of $14.3 million, $7.0 million of asset impairments and $4.4 million of executive severance and
related costs, in addition to other corporate costs of $12.9 million not allocated to the segments. Following is a reconciliation of segment
operating income to the consolidated operating results:
Table 6 — Segment Information
YEAR ENDED DECEMBER 31, 2010 2009 2008
(Amounts in thousands)
Operating income:
Global Funds Transfer $ 139,314 $ 82,647 $ 142,203
Financial Paper Products 36,508 27,372 30,169
Other (2,367) (4,316) (19,883)
Total segment operating income 173,455 105,703 152,489
Net securities (gains) losses (2,115) (7,790) 340,688
Interest expense 102,133 107,911 95,020
Other — (2,401) 20,304
Other unallocated expenses 15,057 30,305 33,668
Income (loss) before income taxes $ 58,380 $ (22,322) $ (337,191)
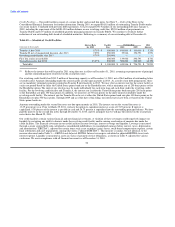
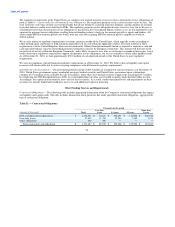
Table 7 — Global Funds Transfer Segment
2010 2009
vs. vs.
YEAR ENDED DECEMBER 31, 2010 2009 2008 2009 2008
(Amounts in thousands)
Money transfer revenue:
Fee and other revenue $ 926,489 $ 890,675 $ 872,849 4% 2%
Investment revenue 244 163 1,873 50% (91)%
Total money transfer revenue 926,733 890,838 874,722 4% 2%
Bill payment revenue:
Fee and other revenue 126,467 134,535 141,169 (6)% (5)%
Investment revenue 81 76 38 7% 100%
Total bill payment revenue 126,548 134,611 141,207 (6)% (5)%
Total Global Funds Transfer revenue:
Fee and other revenue 1,052,956 1,025,210 1,014,018 3% 1%
Investment revenue 325 239 1,911 36% (87)%
Total Global Funds Transfer revenue 1,053,281 1,025,449 1,015,929 3% 1%
Commissions expense $ 496,645 $ 488,116 $ 491,932 2% (1)%
Operating income $ 139,314 $ 82,647 $ 142,203 69% (42)%
Operating margin 13.2% 8.1% 14.0%
2010 Compared to 2009
Total revenue in the Global Funds Transfer segment consists primarily of fees on money transfers and bill payment transactions. For
2010, Global Funds Transfer total revenue increased $27.8 million, or 3 percent, driven by money transfer volume growth, partially offset
by a decline in bill payment revenue.
44