MoneyGram 2010 Annual Report Download - page 130
Download and view the complete annual report
Please find page 130 of the 2010 MoneyGram annual report below. You can navigate through the pages in the report by either clicking on the pages listed below, or by using the keyword search tool below to find specific information within the annual report.-
 1
1 -
2
-
3
-
4
-
5
-
6
-
7
-
8
-
9
-
10
-
11
-
12
-
13
-
14
-
15
-
16
-
17
-
18
-
19
-
20
-
21
-
22
-
23
-
24
-
25
-
26
-
27
-
28
-
29
-
30
-
31
-
32
-
33
-
34
-
35
-
36
-
37
-
38
-
39
-
40
-
41
-
42
-
43
-
44
-
45
-
46
-
47
-
48
-
49
-
50
-
51
-
52
-
53
-
54
-
55
-
56
-
57
-
58
-
59
-
60
-
61
-
62
-
63
-
64
-
65
-
66
-
67
-
68
-
69
-
70
-
71
-
72
-
73
-
74
-
75
-
76
-
77
-
78
-
79
-
80
-
81
-
82
-
83
-
84
-
85
-
86
-
87
-
88
-
89
-
90
-
91
-
92
-
93
-
94
-
95
-
96
-
97
-
98
-
99
-
100
-
101
-
102
-
103
-
104
-
105
-
106
-
107
-
108
-
109
-
110
-
111
-
112
-
113
-
114
-
115
-
116
-
117
-
118
-
119
-
 120
120 -
 121
121 -
 122
122 -
 123
123 -
 124
124 -
 125
125 -
 126
126 -
 127
127 -
 128
128 -
 129
129 -
 130
130 -
 131
131 -
 132
132 -
 133
133 -
 134
134 -
 135
135 -
 136
136 -
 137
137 -
 138
138 -
 139
139 -
 140
140 -
141
-
142
-
143
-
144
-
145
-
146
-
147
-
148
-
149
-
150
-
151
-
152
-
153
-
154
-
155
-
156
-
157
-
158
 |
 |

Table of Contents
MONEYGRAM INTERNATIONAL, INC. AND SUBSIDIARIES
NOTES TO CONSOLIDATED FINANCIAL STATEMENTS — (Continued)
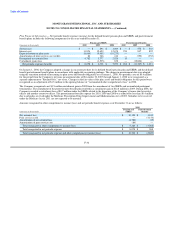
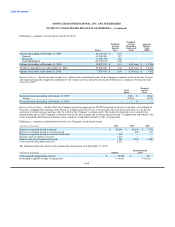
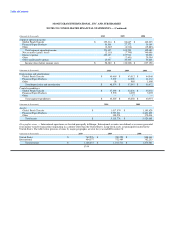
Following is a summary of stock option activity for 2010:
Weighted-
Weighted- Average Aggregate
Average Remaining Intrinsic
Exercise Contractual Value
Shares Price Term ($000)
Options outstanding at December 31, 2009 38,145,414 $ 3.35
Granted 13,000,000 2.87
Exercised (1,098,750) 1.85
Forfeited/Expired (10,149,190) 3.08
Options outstanding at December 31, 2010 39,897,474 $ 3.31 8.49 years $ 12,766
Vested or expected to vest at December 31, 2010 39,528,786 $ 3.32 8.50 years $ 12,670
Options exercisable at December 31, 2010 7,007,474 $ 6.96 6.70 years $ 3,102
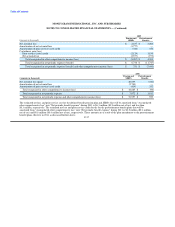
Restricted Stock — Restricted stock awards were valued at the quoted market price of the Company's common stock on the date of grant
and expensed using the straight-line method over the vesting or service period of the award. Following is a summary of restricted stock
activity for 2010:
Weighted
Total Average
Shares Price
Restricted stock outstanding at December 31, 2009 9,674 $ 29.26
Vested (9,674) 29.26
Restricted stock outstanding at December 31, 2010 — $ —
Restricted Stock Units — In May 2010, the Company granted an aggregate of 223,888 restricted stock units to members of the Board of
Directors, excluding the Chairman of the Board, as compensation for services to be provided. The restricted stock units vest on the first
anniversary of their issuance and may only be settled in the Company's common stock. The restricted stock units were valued at the
quoted market price of the Company's common stock on the date of grant and are being expensed to the "Compensation and benefits" line
in the Consolidated Statements of Income (Loss) using the straight-line method over the vesting period.
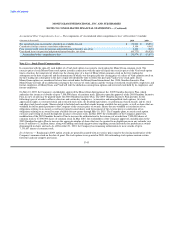
Following is a summary of information related to the Company's stock-based awards:
(Amounts in thousands) 2010 2009 2008
Expense recognized related to options $ 25,643 $ 14,459 $ 3,274
Expense recognized related to restricted stock 8 (307) 417
Expense recognized related to restricted stock units 360 — —
Intrinsic value of options exercised 1,263 — —
Market value of restricted stock vested 283 1,550 1,200
Cash received from option exercises 2,031 — —
The following represents stock-based compensation information as of December 31, 2010:
Restricted Stock
(Amounts in thousands) Options Units
Unrecognized compensation expense $ 35,788 $ 240
Remaining weighted-average vesting period 1.4 years 0.4 years
F-45