MoneyGram 2010 Annual Report Download - page 139
Download and view the complete annual report
Please find page 139 of the 2010 MoneyGram annual report below. You can navigate through the pages in the report by either clicking on the pages listed below, or by using the keyword search tool below to find specific information within the annual report.-
 1
1 -
2
-
3
-
4
-
5
-
6
-
7
-
8
-
9
-
10
-
11
-
12
-
13
-
14
-
15
-
16
-
17
-
18
-
19
-
20
-
21
-
22
-
23
-
24
-
25
-
26
-
27
-
28
-
29
-
30
-
31
-
32
-
33
-
34
-
35
-
36
-
37
-
38
-
39
-
40
-
41
-
42
-
43
-
44
-
45
-
46
-
47
-
48
-
49
-
50
-
51
-
52
-
53
-
54
-
55
-
56
-
57
-
58
-
59
-
60
-
61
-
62
-
63
-
64
-
65
-
66
-
67
-
68
-
69
-
70
-
71
-
72
-
73
-
74
-
75
-
76
-
77
-
78
-
79
-
80
-
81
-
82
-
83
-
84
-
85
-
86
-
87
-
88
-
89
-
90
-
91
-
92
-
93
-
94
-
95
-
96
-
97
-
98
-
99
-
100
-
101
-
102
-
103
-
104
-
105
-
106
-
107
-
108
-
109
-
110
-
111
-
112
-
113
-
114
-
115
-
116
-
117
-
118
-
119
-
120
-
121
-
122
-
123
-
124
-
125
-
126
-
127
-
128
-
 129
129 -
 130
130 -
 131
131 -
 132
132 -
 133
133 -
 134
134 -
 135
135 -
 136
136 -
 137
137 -
 138
138 -
 139
139 -
 140
140 -
 141
141 -
 142
142 -
 143
143 -
 144
144 -
 145
145 -
 146
146 -
 147
147 -
 148
148 -
 149
149 -
150
-
151
-
152
-
153
-
154
-
155
-
156
-
157
-
158
 |
 |

Table of Contents
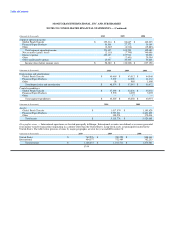
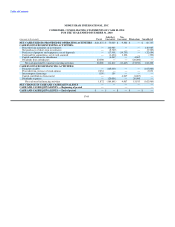
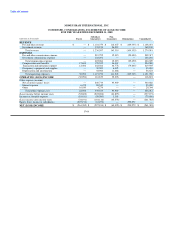
MONEYGRAM INTERNATIONAL, INC. AND SUBSIDIARIES
NOTES TO CONSOLIDATED FINANCIAL STATEMENTS — (Continued)
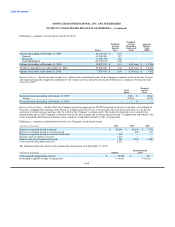
(Amounts in thousands) 2010 2009 2008
Segment operating income:
Global Funds Transfer $ 139,314 $ 82,647 $ 142,203
Financial Paper Products 36,508 27,372 30,169
Other (2,367) (4,316) (19,883)
Total segment operating income 173,455 105,703 152,489
Net securities (gains) losses (2,115) (7,790) 340,688
Interest expense 102,133 107,911 95,020
Other — (2,401) 20,304
Other unallocated expenses 15,057 30,305 33,668
Income (loss) before income taxes $ 58,380 $ (22,322) $ (337,191)
(Amounts in thousands) 2010 2009 2008
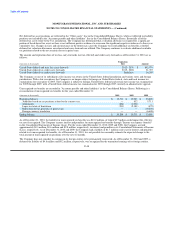
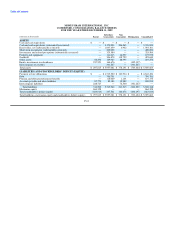
Depreciation and amortization:
Global Funds Transfer $ 40,489 $ 43,512 $ 44,540
Financial Paper Products 7,527 12,590 11,132
Other 58 989 1,000
Total depreciation and amortization $ 48,074 $ 57,091 $ 56,672
Capital expenditures:
Global Funds Transfer $ 37,090 $ 32,236 $ 35,352
Financial Paper Products 5,935 6,005 5,005
Other — 17 —
Total capital expenditures $ 43,025 $ 38,258 $ 40,357
(Amounts in thousands) 2010 2009
Assets:
Global Funds Transfer $ 1,017,574 $ 1,150,820
Financial Paper Products 3,797,911 4,403,829
Other 300,251 375,014
Total assets $ 5,115,736 $ 5,929,663
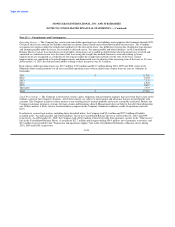
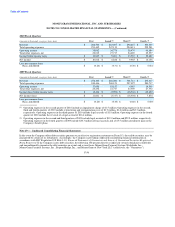
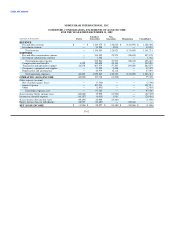
Geographic areas — International operations are located principally in Europe. International revenues are defined as revenues generated
from money transfer transactions originating in a country other than the United States. Long-lived assets are principally located in the
United States. The table below presents revenue by major geographic area for the year ended December 31:
(Amounts in thousands) 2010 2009 2008
United States $ 762,276 $ 789,222 $ 888,348
International 404,377 372,489 382,233
Total revenue $ 1,166,653 $ 1,161,711 $ 1,270,581
F-54