MoneyGram 2010 Annual Report Download - page 41
Download and view the complete annual report
Please find page 41 of the 2010 MoneyGram annual report below. You can navigate through the pages in the report by either clicking on the pages listed below, or by using the keyword search tool below to find specific information within the annual report.-
 1
1 -
2
-
3
-
4
-
5
-
6
-
7
-
8
-
9
-
10
-
11
-
12
-
13
-
14
-
15
-
16
-
17
-
18
-
19
-
20
-
21
-
22
-
23
-
24
-
25
-
26
-
27
-
28
-
29
-
30
-
 31
31 -
 32
32 -
 33
33 -
 34
34 -
 35
35 -
 36
36 -
 37
37 -
 38
38 -
 39
39 -
 40
40 -
 41
41 -
 42
42 -
 43
43 -
 44
44 -
 45
45 -
 46
46 -
 47
47 -
 48
48 -
 49
49 -
 50
50 -
 51
51 -
52
-
53
-
54
-
55
-
56
-
57
-
58
-
59
-
60
-
61
-
62
-
63
-
64
-
65
-
66
-
67
-
68
-
69
-
70
-
71
-
72
-
73
-
74
-
75
-
76
-
77
-
78
-
79
-
80
-
81
-
82
-
83
-
84
-
85
-
86
-
87
-
88
-
89
-
90
-
91
-
92
-
93
-
94
-
95
-
96
-
97
-
98
-
99
-
100
-
101
-
102
-
103
-
104
-
105
-
106
-
107
-
108
-
109
-
110
-
111
-
112
-
113
-
114
-
115
-
116
-
117
-
118
-
119
-
120
-
121
-
122
-
123
-
124
-
125
-
126
-
127
-
128
-
129
-
130
-
131
-
132
-
133
-
134
-
135
-
136
-
137
-
138
-
139
-
140
-
141
-
142
-
143
-
144
-
145
-
146
-
147
-
148
-
149
-
150
-
151
-
152
-
153
-
154
-
155
-
156
-
157
-
158
 |
 |

Table of Contents
Expenses
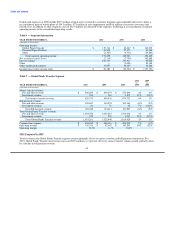
The following discussion relates to operating expenses, excluding commissions expense, as presented in Table 1 — Results of
Operations.
Compensation and benefits — Compensation and benefits includes salaries and benefits, management incentive programs and other
employee related costs. Compensation and benefits increased $27.4 million, or 14 percent, in 2010 compared to 2009. Included in 2009
was a $14.3 million net curtailment gain on benefit plans, partially offset by $3.9 million of executive severance costs. The remaining
increase in 2010 primarily relates to a $11.2 million increase in stock-based compensation from grants made in 2010 and the second half
of 2009 in connection with executive hires, $3.0 million of severance associated with restructuring initiatives and a $1.6 million increase
in incentive compensation from higher participation levels, which increased the compensation base as compared to the prior year,
partially offset by lower sales incentives accruals. As reflected in each of the amounts discussed above, the decrease in the euro exchange
rate decreased compensation and benefits expense by $2.8 million in 2010.
Compensation and benefits decreased $25.5 million, or 11 percent, in 2009 compared to 2008 primarily from a $14.3 million net
curtailment gain on benefit plans, a $12.3 million decrease in executive severance and related costs, a $7.1 million decrease in incentive
compensation from accruing annual incentives at a lower tier and a $2.0 million decrease from the suspension of the discretionary profit
sharing plan. Stock-based compensation increased $10.5 million due to option grants awarded in 2009, partially offset by lower expense
from historical grants that vested in the first quarter of 2009 and executive forfeitures. As reflected in each of the amounts discussed
above, the decrease in the euro exchange rate decreased compensation and benefits by $2.1 million in 2009.
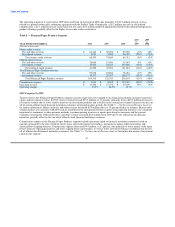
Transaction and operations support — Transaction and operations support expense includes marketing, professional fees and other
outside services, telecommunications and agent forms related to our products. Transaction and operations support costs decreased
$98.5 million, or 35 percent, in 2010 compared to 2009. Expenses in 2009 included $54.8 million of legal reserves relating to securities
litigation, a patent lawsuit and a settlement with the Federal Trade Commission, $18.3 million of goodwill and asset impairments, an
incremental provision for loss of $15.0 million primarily related to the closure of an international agent and consultant fees of
$6.4 million related to the implementation of the European Union Payment Services Directive. Expenses in 2010 benefited from a
$16.4 million reversal of legal reserves related to a patent lawsuit and a $4.8 million reduction in expenses related to telecommunications
and agent forms and supplies due to cost savings initiatives. Partially offsetting these benefits was $6.9 million of incremental marketing
costs to support transaction and agent growth, asset impairments of $1.8 million, $1.4 million of incremental licensing fees from
international growth and $1.3 million of restructuring and related costs. As reflected in each of the amounts discussed above, the decline
in the euro exchange rate decreased transactions and operations support expense by $3.1 million in 2010. In addition, the impact of
foreign exchange rate movements on our foreign denominated assets and liabilities, or revaluation, generated $2.5 million of incremental
expense in 2010.
38