MoneyGram 2010 Annual Report Download - page 53
Download and view the complete annual report
Please find page 53 of the 2010 MoneyGram annual report below. You can navigate through the pages in the report by either clicking on the pages listed below, or by using the keyword search tool below to find specific information within the annual report.-
 1
1 -
2
-
3
-
4
-
5
-
6
-
7
-
8
-
9
-
10
-
11
-
12
-
13
-
14
-
15
-
16
-
17
-
18
-
19
-
20
-
21
-
22
-
23
-
24
-
25
-
26
-
27
-
28
-
29
-
30
-
31
-
32
-
33
-
34
-
35
-
36
-
37
-
38
-
39
-
40
-
41
-
42
-
 43
43 -
 44
44 -
 45
45 -
 46
46 -
 47
47 -
 48
48 -
 49
49 -
 50
50 -
 51
51 -
 52
52 -
 53
53 -
 54
54 -
 55
55 -
 56
56 -
 57
57 -
 58
58 -
 59
59 -
 60
60 -
 61
61 -
 62
62 -
 63
63 -
64
-
65
-
66
-
67
-
68
-
69
-
70
-
71
-
72
-
73
-
74
-
75
-
76
-
77
-
78
-
79
-
80
-
81
-
82
-
83
-
84
-
85
-
86
-
87
-
88
-
89
-
90
-
91
-
92
-
93
-
94
-
95
-
96
-
97
-
98
-
99
-
100
-
101
-
102
-
103
-
104
-
105
-
106
-
107
-
108
-
109
-
110
-
111
-
112
-
113
-
114
-
115
-
116
-
117
-
118
-
119
-
120
-
121
-
122
-
123
-
124
-
125
-
126
-
127
-
128
-
129
-
130
-
131
-
132
-
133
-
134
-
135
-
136
-
137
-
138
-
139
-
140
-
141
-
142
-
143
-
144
-
145
-
146
-
147
-
148
-
149
-
150
-
151
-
152
-
153
-
154
-
155
-
156
-
157
-
158
 |
 |

Table of Contents
LIQUIDITY AND CAPITAL RESOURCES
We have various resources available to us for purposes of managing liquidity and capital needs, including our investment portfolio, credit
facilities and letters of credit. We refer to our cash and cash equivalents, short-term investments, trading investments and related put
options and available-for-sale investments collectively as our "investment portfolio." We utilize the assets in excess of payment service
obligations measure shown below in various liquidity and capital assessments. While assets in excess of payment service obligations, as
defined, is a capital measure, it also serves as the foundation for various liquidity analyses.
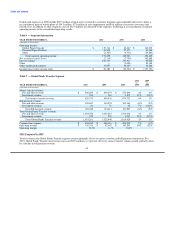
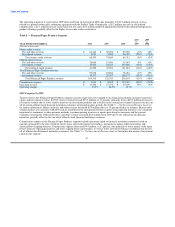
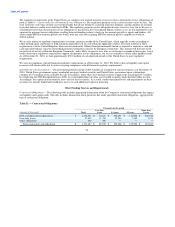
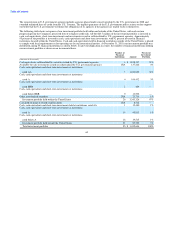
Table 9 — Assets in Excess of Payment Service Obligations
(Amounts in thousands) 2010 2009
Cash and cash equivalents (substantially restricted) $ 2,865,941 $ 3,376,824
Receivables, net (substantially restricted) 982,319 1,054,381
Short-term investments (substantially restricted) 405,769 400,000
Trading investments and related put options (substantially restricted) — 26,951
Available-for-sale investments (substantially restricted) 160,936 298,633
4,414,965 5,156,789
Payment service obligations (4,184,736) (4,843,454)
Assets in excess of payment service obligations $ 230,229 $ 313,335
Liquidity
Our primary sources of liquidity include cash flows generated by the sale of our payment instruments, our cash and cash equivalent and
short-term investment balances, proceeds from our investment portfolio and credit capacity under our credit facilities. Our primary
operating liquidity needs relate to the settlement of payment service obligations to our agents and financial institution customers, as well
as general operating expenses.
To meet our payment service obligations at all times, we must have sufficient highly liquid assets and be able to move funds globally on a
timely basis. On average, we pay over $1.0 billion a day to settle our payment service obligations. We generally receive a similar amount
on a daily basis for the principal amount of our payment instruments sold and the related fees. We use the incoming funds from sales of
new payment instruments to settle our payment service obligations for previously sold payment instruments. This pattern of cash flows
allows us to settle our payment service obligations through on-going cash generation rather than liquidating investments or utilizing our
revolving credit facility. We have historically generated, and expect to continue generating, sufficient cash flows from daily operations to
fund ongoing operational needs.
The timely remittance of funds by our agents and financial institution customers is an important component of our liquidity and allows
for the pattern of cash flows described above. If the timing of the remittance of funds were to deteriorate, it would alter our pattern of
cash flows and could require us to liquidate investments or utilize our revolving credit facility to settle payment service obligations. To
manage this risk, we closely monitor the remittance patterns of our agents and financial institution customers and act quickly if we detect
deterioration or alteration in remittance timing or patterns. If deemed appropriate, we have the ability to deactivate an agent's equipment
at any time, thereby preventing the initiation or issuance of further money transfers and money orders. See "Enterprise Risk Management
— Credit Risk" for further discussion of this risk and our mitigation efforts.
We also seek to maintain liquidity beyond our operating needs to provide a cushion through the normal fluctuations in our payment
service assets and obligations and to invest in the infrastructure and growth of our business. While the assets in excess of payment service
obligations, as shown in Table 9, would be available to us for our general operating needs and investment in the Company, we consider a
portion of our assets in excess of payment service obligations as additional assurance that regulatory and contractual requirements are
maintained. We believe we have sufficient assets and liquidity to operate and grow our business for the next 12 months. Should our
liquidity needs exceed our operating cash flows, we believe that our external financing sources, including availability under our senior
facility, will be sufficient to meet any liquidity needs.
50