MoneyGram 2010 Annual Report Download - page 44
Download and view the complete annual report
Please find page 44 of the 2010 MoneyGram annual report below. You can navigate through the pages in the report by either clicking on the pages listed below, or by using the keyword search tool below to find specific information within the annual report.-
 1
1 -
2
-
3
-
4
-
5
-
6
-
7
-
8
-
9
-
10
-
11
-
12
-
13
-
14
-
15
-
16
-
17
-
18
-
19
-
20
-
21
-
22
-
23
-
24
-
25
-
26
-
27
-
28
-
29
-
30
-
31
-
32
-
33
-
 34
34 -
 35
35 -
 36
36 -
 37
37 -
 38
38 -
 39
39 -
 40
40 -
 41
41 -
 42
42 -
 43
43 -
 44
44 -
 45
45 -
 46
46 -
 47
47 -
 48
48 -
 49
49 -
 50
50 -
 51
51 -
 52
52 -
 53
53 -
 54
54 -
55
-
56
-
57
-
58
-
59
-
60
-
61
-
62
-
63
-
64
-
65
-
66
-
67
-
68
-
69
-
70
-
71
-
72
-
73
-
74
-
75
-
76
-
77
-
78
-
79
-
80
-
81
-
82
-
83
-
84
-
85
-
86
-
87
-
88
-
89
-
90
-
91
-
92
-
93
-
94
-
95
-
96
-
97
-
98
-
99
-
100
-
101
-
102
-
103
-
104
-
105
-
106
-
107
-
108
-
109
-
110
-
111
-
112
-
113
-
114
-
115
-
116
-
117
-
118
-
119
-
120
-
121
-
122
-
123
-
124
-
125
-
126
-
127
-
128
-
129
-
130
-
131
-
132
-
133
-
134
-
135
-
136
-
137
-
138
-
139
-
140
-
141
-
142
-
143
-
144
-
145
-
146
-
147
-
148
-
149
-
150
-
151
-
152
-
153
-
154
-
155
-
156
-
157
-
158
 |
 |

Table of Contents
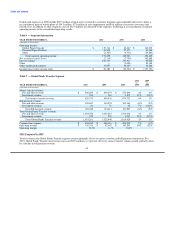
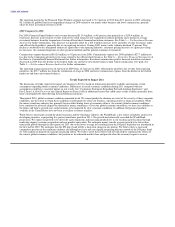
We had a tax benefit of $20.4 million in 2009, primarily reflecting a release of $17.6 million of valuation allowances on realized deferred
tax assets related to the U.S. jurisdiction. Our pre-tax net loss of $22.3 million, when adjusted for our estimated book to tax differences,
resulted in taxable income, which allowed us to release some valuation allowances on our tax loss carryovers. The book to tax differences
include impairments on securities and other assets and accruals related to separated employees, litigation and unrealized foreign exchange
losses.
In 2008, we had a $75.8 million tax benefit, primarily reflecting the recognition of a $90.5 million benefit in the fourth quarter of 2008
upon the completion of an evaluation of the technical merits of tax positions with respect to part of the net securities losses in 2008 and
2007. The $90.5 million benefit relates to the amount of tax carry-back we were able to utilize to recover tax payments made for fiscal
2005 through 2007.
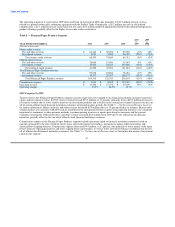
As of December 31, 2010, our net deferred tax liability position of $4.3 million reflects $544.8 million of gross deferred tax assets,
$63.3 million of gross deferred tax liabilities and a $485.8 million valuation allowance. Essentially all of our deferred tax assets relate to
the U.S. jurisdiction. In 2007, we determined it was appropriate to establish a valuation allowance for a significant portion of our gross
deferred tax assets as we did not believe that we had sufficient positive evidence to overcome the significant negative evidence of a three
year cumulative loss. We continue to believe that it is appropriate to maintain a valuation allowance for a significant portion of our
deferred tax assets due to significant negative evidence. Changes in facts and circumstances in the future may cause us to record
additional tax benefits as further deferred tax valuation allowances are released and carry-forwards are utilized. We continue to evaluate
additional available tax positions related to the net securities losses in prior years.
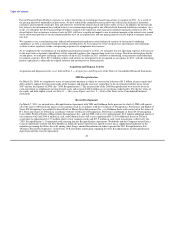
Earnings Before Interest, Taxes, Depreciation and Amortization ("EBITDA") and Adjusted EBITDA
We believe that EBITDA (earnings before interest, taxes, depreciation and amortization, including agent signing bonus amortization) and
Adjusted EBITDA (EBITDA adjusted for significant items) provide useful information to investors because they are an indicator of the
strength and performance of ongoing business operations, including our ability to service debt and fund capital expenditures, acquisitions
and operations. These calculations are commonly used as a basis for investors, analysts and credit rating agencies to evaluate and
compare the operating performance and value of companies within our industry. In addition, our debt agreements require compliance
with financial measures similar to Adjusted EBITDA. Finally, EBITDA and Adjusted EBITDA are financial measures used by
management in reviewing results of operations, forecasting, assessing cash flow and capital, allocating resources and establishing
employee incentive programs.
41