MoneyGram 2010 Annual Report Download - page 49
Download and view the complete annual report
Please find page 49 of the 2010 MoneyGram annual report below. You can navigate through the pages in the report by either clicking on the pages listed below, or by using the keyword search tool below to find specific information within the annual report.-
 1
1 -
2
-
3
-
4
-
5
-
6
-
7
-
8
-
9
-
10
-
11
-
12
-
13
-
14
-
15
-
16
-
17
-
18
-
19
-
20
-
21
-
22
-
23
-
24
-
25
-
26
-
27
-
28
-
29
-
30
-
31
-
32
-
33
-
34
-
35
-
36
-
37
-
38
-
 39
39 -
 40
40 -
 41
41 -
 42
42 -
 43
43 -
 44
44 -
 45
45 -
 46
46 -
 47
47 -
 48
48 -
 49
49 -
 50
50 -
 51
51 -
 52
52 -
 53
53 -
 54
54 -
 55
55 -
 56
56 -
 57
57 -
 58
58 -
 59
59 -
60
-
61
-
62
-
63
-
64
-
65
-
66
-
67
-
68
-
69
-
70
-
71
-
72
-
73
-
74
-
75
-
76
-
77
-
78
-
79
-
80
-
81
-
82
-
83
-
84
-
85
-
86
-
87
-
88
-
89
-
90
-
91
-
92
-
93
-
94
-
95
-
96
-
97
-
98
-
99
-
100
-
101
-
102
-
103
-
104
-
105
-
106
-
107
-
108
-
109
-
110
-
111
-
112
-
113
-
114
-
115
-
116
-
117
-
118
-
119
-
120
-
121
-
122
-
123
-
124
-
125
-
126
-
127
-
128
-
129
-
130
-
131
-
132
-
133
-
134
-
135
-
136
-
137
-
138
-
139
-
140
-
141
-
142
-
143
-
144
-
145
-
146
-
147
-
148
-
149
-
150
-
151
-
152
-
153
-
154
-
155
-
156
-
157
-
158
 |
 |

Table of Contents
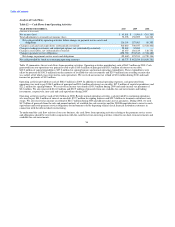
2009 Compared to 2008
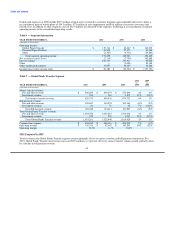
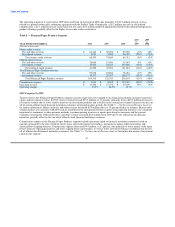
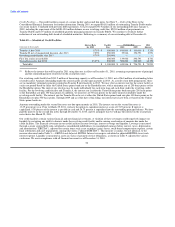
For 2009, Global Funds Transfer total revenue increased $9.5 million, or 1 percent, due primarily to money transfer fee revenue growth,
partially offset by lower bill payment revenue and lower investment revenue. Investment revenue decreased $1.7 million due to lower
yields earned on our investment portfolio. See Table 3 — Net Investment Revenue Analysis for further information regarding average
investment balances and yields on the consolidated investment portfolio.
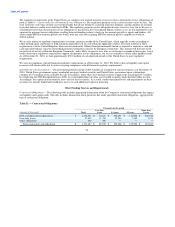
Money transfer fee and other revenue grew $17.8 million, or 2 percent, driven by money transfer transaction volume growth, partially
offset by lower average money transfer fees and the decline in the euro exchange rate. Money transfer transaction volume increased
6 percent, generating incremental revenue of $54.5 million. Volume growth in 2009 was lower than the prior year, reflecting the slowing
economic conditions in 2009 and a growing volume base. Average money transfer fees declined from lower principal per transaction and
corridor mix, reducing revenue by $15.8 million. The decline in the euro exchange rate, net of hedging activities, reduced revenue by
$16.2 million in 2009.
Through the third quarter of 2009, pricing on money transfers remained stable. During the fourth quarter of 2009, we implemented a low-
fee promotion with our largest agent, reducing the average fee per transaction. In January 2008, we launched our MoneyGram Rewards
loyalty program in the United States, which provided tiered discounts on transaction fees to our repeat consumers, less paperwork and
notifications to the sender when the funds are received, among other features. In 2009, we rolled out MoneyGram Rewards in Canada,
France, Germany, Spain and certain agent locations in Italy. Our MoneyGram Rewards program has positively impacted our transaction
volumes, with membership in the program up 30 percent as of December 31, 2009 compared to 2008 and transaction volumes from
members up 34 percent.
Money transfer transactions originated in the Americas increased 6 percent. Transactions originating in the United States, excluding
transactions sent to Mexico, increased 9 percent due primarily to intra-United States remittances. Canada and Latin America saw
transaction growth of 15 percent and 9 percent, respectively, from agent network growth. Transactions sent to Mexico declined 9 percent,
reflecting the impact of the United States recession on our consumers. Mexico represented approximately 10 percent of our total
transactions in 2009 as compared to 12 percent in 2008. Transactions originated in EMEAAP increased 6 percent despite a negative
9 percentage point impact from volume declines in Spain. EMEAAP transactions accounted for 24 percent of our volume in 2009 and
2008. The fastest growing regions in 2009 were South East and Central Africa, the Philippines and South Asia, which all had double-digit
growth. The Middle East saw transaction growth of 9 percent, driven by send transactions from, and agent signings and renewals in, the
United Arab Emirates. Our France retail business saw transaction growth of 155 percent, while the United Kingdom saw transaction
growth of 6 percent primarily from sends to India and Eastern Europe, as well as growth from our three largest agents in the United
Kingdom. Greece had transaction growth of 14 percent through its receive markets in Eastern Europe. Spain had volume declines of
24 percent from local economic conditions.
Bill payment fee and other revenue decreased $6.6 million, or 5 percent, from 2008 from a 4 percent decrease in transaction volume.
Lower bill payment volumes reduced revenue by $4.9 million, reflecting the departure of a large biller in the third quarter of 2008 and the
impact of economic conditions on our bill payment customers. In addition, lower principal per transaction and biller vertical mix reduced
revenue by $1.7 million in 2009.
Commissions expense for 2009 decreased $3.8 million, primarily from lower commission rates and the decline in the euro exchange rate,
partially offset by growth in money transfer transaction volume. Money transfer transaction volume growth resulted in incremental
commissions expense of $16.1 million, while lower commission rates and the decline in the euro exchange rate, net of hedging activities,
reduced commissions expense by $7.7 million and $6.9 million, respectively. Bill payment fee commissions expense decreased
$3.8 million due to volume declines, partially offset by a $0.6 million increase due to higher average rates. Commissions expense in 2009
also decreased by $2.5 million primarily from lower signing bonus amortization as certain historical signing bonuses were fully
amortized in the third quarter of 2009.
46