MoneyGram 2010 Annual Report Download - page 63
Download and view the complete annual report
Please find page 63 of the 2010 MoneyGram annual report below. You can navigate through the pages in the report by either clicking on the pages listed below, or by using the keyword search tool below to find specific information within the annual report.-
 1
1 -
2
-
3
-
4
-
5
-
6
-
7
-
8
-
9
-
10
-
11
-
12
-
13
-
14
-
15
-
16
-
17
-
18
-
19
-
20
-
21
-
22
-
23
-
24
-
25
-
26
-
27
-
28
-
29
-
30
-
31
-
32
-
33
-
34
-
35
-
36
-
37
-
38
-
39
-
40
-
41
-
42
-
43
-
44
-
45
-
46
-
47
-
48
-
49
-
50
-
51
-
52
-
 53
53 -
 54
54 -
 55
55 -
 56
56 -
 57
57 -
 58
58 -
 59
59 -
 60
60 -
 61
61 -
 62
62 -
 63
63 -
 64
64 -
 65
65 -
 66
66 -
 67
67 -
 68
68 -
 69
69 -
 70
70 -
 71
71 -
 72
72 -
 73
73 -
74
-
75
-
76
-
77
-
78
-
79
-
80
-
81
-
82
-
83
-
84
-
85
-
86
-
87
-
88
-
89
-
90
-
91
-
92
-
93
-
94
-
95
-
96
-
97
-
98
-
99
-
100
-
101
-
102
-
103
-
104
-
105
-
106
-
107
-
108
-
109
-
110
-
111
-
112
-
113
-
114
-
115
-
116
-
117
-
118
-
119
-
120
-
121
-
122
-
123
-
124
-
125
-
126
-
127
-
128
-
129
-
130
-
131
-
132
-
133
-
134
-
135
-
136
-
137
-
138
-
139
-
140
-
141
-
142
-
143
-
144
-
145
-
146
-
147
-
148
-
149
-
150
-
151
-
152
-
153
-
154
-
155
-
156
-
157
-
158
 |
 |
Table of Contents
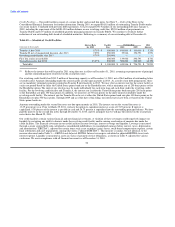
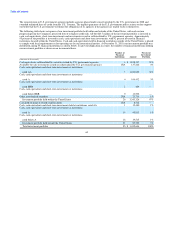
The concentration in U.S. government agencies includes agencies placed under conservatorship by the U.S. government in 2008 and
extended unlimited lines of credit from the U.S. Treasury. The implicit guarantee of the U.S. government and its actions to date support
our belief that the U.S. government will honor the obligations of its agencies if the agencies are unable to do so themselves.
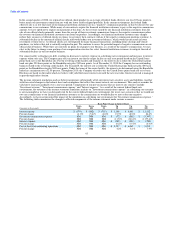
The following table shows categories of our investment portfolio held within and outside of the United States, with each section
progressing from the Company's perceived lowest to highest credit risk. All but $23.7 million of the investment portfolio is invested in
cash, cash equivalents, short-term investments and investments issued or collateralized by U.S. government agencies. Approximately
95 percent of the portfolio is invested in cash, cash equivalents and short-term investments, with 92 percent invested in financial
institutions located within the United States. Cash and cash equivalents held in financial institutions outside of the United States is placed
to comply with local requirements or for operating use by our international entities. At December 31, 2010, our investment portfolio was
distributed among 55 financial institutions as shown below. To prevent duplication in counts, the number of financial institutions holding
our investment portfolio is shown on an incremental basis.
Number of Percent of
Financial Investment
Institutions Amount Portfolio
(Amounts in thousands)
Cash equivalents collateralized by securities issued by U.S. government agencies 6 $ 1,818,137 53%
Available-for-sale investments issued or collateralized by U.S. government agencies N/A 137,226 4%
Cash, cash equivalents and short-term investments at institutions
rated AA 5 1,243,820 36%
Cash, cash equivalents and short-term investments at institutions
rated A 4 106,432 3%
Cash, cash equivalents and short-term investments at institutions
rated BBB 2 409 —
Cash, cash equivalents and short-term investments at institutions
rated below BBB 9 13,592 —
Other asset-backed securities N/A 23,710 1%
Investment portfolio held within the United States 26 3,343,326 97%
Cash held on-hand at owned retail locations N/A 8,512 —
Cash, cash equivalents and short-term investments held at institutions rated AA 1 15,480 1%
Cash, cash equivalents and short-term investments at institutions
rated A 10 45,813 1%
Cash, cash equivalents and short-term investments at institutions
rated below A 18 19,515 1%
Investment portfolio held outside the United States 29 89,320 3%
Total investment portfolio 55 $ 3,432,646 100%
60