MoneyGram 2010 Annual Report Download - page 146
Download and view the complete annual report
Please find page 146 of the 2010 MoneyGram annual report below. You can navigate through the pages in the report by either clicking on the pages listed below, or by using the keyword search tool below to find specific information within the annual report.-
 1
1 -
2
-
3
-
4
-
5
-
6
-
7
-
8
-
9
-
10
-
11
-
12
-
13
-
14
-
15
-
16
-
17
-
18
-
19
-
20
-
21
-
22
-
23
-
24
-
25
-
26
-
27
-
28
-
29
-
30
-
31
-
32
-
33
-
34
-
35
-
36
-
37
-
38
-
39
-
40
-
41
-
42
-
43
-
44
-
45
-
46
-
47
-
48
-
49
-
50
-
51
-
52
-
53
-
54
-
55
-
56
-
57
-
58
-
59
-
60
-
61
-
62
-
63
-
64
-
65
-
66
-
67
-
68
-
69
-
70
-
71
-
72
-
73
-
74
-
75
-
76
-
77
-
78
-
79
-
80
-
81
-
82
-
83
-
84
-
85
-
86
-
87
-
88
-
89
-
90
-
91
-
92
-
93
-
94
-
95
-
96
-
97
-
98
-
99
-
100
-
101
-
102
-
103
-
104
-
105
-
106
-
107
-
108
-
109
-
110
-
111
-
112
-
113
-
114
-
115
-
116
-
117
-
118
-
119
-
120
-
121
-
122
-
123
-
124
-
125
-
126
-
127
-
128
-
129
-
130
-
131
-
132
-
133
-
134
-
135
-
 136
136 -
 137
137 -
 138
138 -
 139
139 -
 140
140 -
 141
141 -
 142
142 -
 143
143 -
 144
144 -
 145
145 -
 146
146 -
 147
147 -
 148
148 -
 149
149 -
 150
150 -
 151
151 -
 152
152 -
 153
153 -
 154
154 -
 155
155 -
 156
156 -
157
-
158
 |
 |
Table of Contents
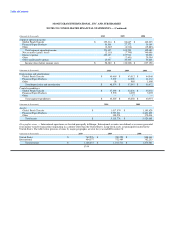
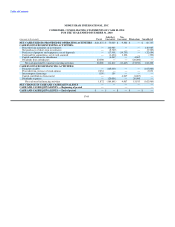
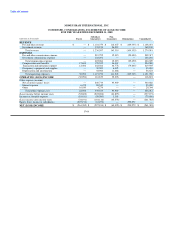
MONEYGRAM INTERNATIONAL, INC.
CONDENSED, CONSOLIDATING BALANCE SHEETS
FOR THE YEAR ENDED DECEMBER 31, 2009
Subsidiary Non-
(Amounts in thousands) Parent Guarantors Guarantors Eliminations Consolidated
ASSETS
Cash and cash equivalents $ — $ — $ — $ — $ —
Cash and cash equivalents (substantially restricted) — 3,170,259 206,565 — 3,376,824
Receivables, net (substantially restricted) — 1,047,459 6,922 — 1,054,381
Short-term investments (substantially restricted) — 400,000 — — 400,000
Investments and related put options (substantially restricted) — 325,584 — — 325,584
Property and equipment — 111,015 16,957 — 127,972
Goodwill — 306,878 118,752 — 425,630
Other assets 60,294 129,983 28,995 — 219,272
Equity investments in subsidiaries 237,521 164,676 — (402,197) —
Intercompany receivables 301,227 — (301,227) —
Total assets $ 297,815 $ 5,957,081 $ 378,191 $ (703,424) $ 5,929,663
LIABILITIES AND STOCKHOLDERS' DEFICIT (EQUITY)
Payment service obligations $ — $ 4,719,520 $ 123,934 $ — $ 4,843,454
Debt — 796,791 — — 796,791
Pension and other postretirement benefits — 118,069 1,101 — 119,170
Accounts payable and other liabilities 87,773 85,180 15,980 — 188,933
Intercompany liabilities 228,727 — 72,500 (301,227) —
Total liabilities 316,500 5,719,560 213,515 (301,227) 5,948,348
Mezzanine equity 864,328 — — — 864,328
Total stockholders' deficit (equity) (883,013) 237,521 164,676 (402,197) (883,013)
Total liabilities, mezzanine equity and stockholders' deficit (equity) $ 297,815 $ 5,957,081 $ 378,191 $ (703,424) $ 5,929,663
F-61