Duke Energy 2014 Annual Report Download - page 73
Download and view the complete annual report
Please find page 73 of the 2014 Duke Energy annual report below. You can navigate through the pages in the report by either clicking on the pages listed below, or by using the keyword search tool below to find specific information within the annual report.-
 1
1 -
2
-
3
-
4
-
5
-
6
-
7
-
8
-
9
-
10
-
11
-
12
-
13
-
14
-
15
-
16
-
17
-
18
-
19
-
20
-
21
-
22
-
23
-
24
-
25
-
26
-
27
-
28
-
29
-
30
-
31
-
32
-
33
-
34
-
35
-
36
-
37
-
38
-
39
-
40
-
41
-
42
-
43
-
44
-
45
-
46
-
47
-
48
-
49
-
50
-
51
-
52
-
53
-
54
-
55
-
56
-
57
-
58
-
59
-
60
-
61
-
62
-
 63
63 -
 64
64 -
 65
65 -
 66
66 -
 67
67 -
 68
68 -
 69
69 -
 70
70 -
 71
71 -
 72
72 -
 73
73 -
 74
74 -
 75
75 -
 76
76 -
 77
77 -
 78
78 -
 79
79 -
 80
80 -
 81
81 -
 82
82 -
 83
83 -
84
-
85
-
86
-
87
-
88
-
89
-
90
-
91
-
92
-
93
-
94
-
95
-
96
-
97
-
98
-
99
-
100
-
101
-
102
-
103
-
104
-
105
-
106
-
107
-
108
-
109
-
110
-
111
-
112
-
113
-
114
-
115
-
116
-
117
-
118
-
119
-
120
-
121
-
122
-
123
-
124
-
125
-
126
-
127
-
128
-
129
-
130
-
131
-
132
-
133
-
134
-
135
-
136
-
137
-
138
-
139
-
140
-
141
-
142
-
143
-
144
-
145
-
146
-
147
-
148
-
149
-
150
-
151
-
152
-
153
-
154
-
155
-
156
-
157
-
158
-
159
-
160
-
161
-
162
-
163
-
164
-
165
-
166
-
167
-
168
-
169
-
170
-
171
-
172
-
173
-
174
-
175
-
176
-
177
-
178
-
179
-
180
-
181
-
182
-
183
-
184
-
185
-
186
-
187
-
188
-
189
-
190
-
191
-
192
-
193
-
194
-
195
-
196
-
197
-
198
-
199
-
200
-
201
-
202
-
203
-
204
-
205
-
206
-
207
-
208
-
209
-
210
-
211
-
212
-
213
-
214
-
215
-
216
-
217
-
218
-
219
-
220
-
221
-
222
-
223
-
224
-
225
-
226
-
227
-
228
-
229
-
230
-
231
-
232
-
233
-
234
-
235
-
236
-
237
-
238
-
239
-
240
-
241
-
242
-
243
-
244
-
245
-
246
-
247
-
248
-
249
-
250
-
251
-
252
-
253
-
254
-
255
-
256
-
257
-
258
-
259
-
260
-
261
-
262
-
263
-
264
 |
 |

53
PART II
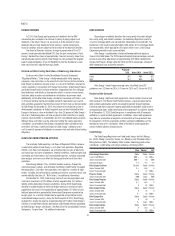
FINANCING CASH FLOWS
The following table summarizes key components of Duke Energy’s
fi nancing cash fl ows for the three most recently completed fi scal years.
(in millions)
Years Ended December 31,
2014 2013 2012
Issuance of common stock related to employee benefi t
plans $25$9$23
Issuance of long-term debt, net (123) 840 1,672
Notes payable and commercial paper 1,688 93 278
Dividends paid (2,234) (2,188) (1,752)
Other fi nancing items (34) (81) 46
Net cash (used in) provided by fi nancing activities $ (678) $ (1,327) $ 267
For the year ended December 31, 2014 compared to 2013, the variance
was driven primarily by:
• A $1,595 million increase in proceeds from net issuances of notes
payable and commercial paper, primarily due to funding a larger
proportion of total fi nancing needs with short-term debt in anticipation
of the receipt in 2015 of proceeds from the sale of the Midwest
Generation business, the proceeds from which will partially be used for
debt reduction, partially offset by;
• A $963 million decrease in net issuances of long-term debt, primarily
due to funding a larger proportion of total fi nancing needs with short-
term debt in 2014 than in 2013.
For the year ended December 31, 2013 compared to 2012, the variance
was driven primarily by:
• An $832 million decrease in net issuances of long-term debt, primarily
due to the timing of issuances and redemptions between years, resulting
from the completion of major construction projects,
• A $436 million increase in quarterly dividends primarily due to an
increase in common shares outstanding, resulting from the merger with
Progress Energy and an increase in dividends per share from $0.765 to
$0.78 in the third quarter of 2013. The total annual dividend per share
was $3.09 in 2013 compared to $3.03 in 2012 and
• A $185 million decrease in proceeds from net issuances of notes
payable and commercial paper, primarily due to changes in short-term
working capital needs.
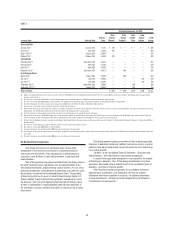
Summary of Signifi cant Debt Issuances
The following table summarizes signifi cant debt issuances (in millions).
Year Ended December 31, 2014
Issuance Date Maturity Date
Interest
Rate
Duke
Energy
(Parent)
Duke
Energy
Progress
Duke
Energy
Florida
Duke
Energy
Unsecured Debt
April 2014(a) April 2024 3.750% $ 600 $ — $ — $ 600
April 2014(a)(b) April 2017 0.613% 400 — — 400
June 2014(c) May 2019 11.970% — — — 108
June 2014(c) May 2021 13.680% — — — 110
Secured Debt
March 2014(d) March 2017 0.863% — — 225 225
July 2014(e) July 2036 5.340% — — — 129
First Mortgage Bonds
March 2014(f) March 2044 4.375% — 400 — 400
March 2014(f)(g) March 2017 0.435% — 250 — 250
November 2014(h) December 2044 4.150% — 500 — 500
November 2014(g)(h) November 2017 0.432% — 200 — 200
Total issuances $ 1,000 $1,350 $ 225 $ 2,922
(a) Proceeds were used to redeem $402 million of tax-exempt bonds at Duke Energy Ohio, the repayment of outstanding commercial paper and for general corporate purposes. See Note 13 to the Consolidated Financial
Statements, “Related Party Transactions” for additional information related to the redemption of Duke Energy Ohio’s tax-exempt bonds.
(b) The debt is fl oating rate based on three-month London Interbank Offered Rate (LIBOR) plus a fi xed credit spread of 38 basis points.
(c) Proceeds were used to repay $196 million of debt for International Energy and for general corporate purposes.
(d) Relates to the securitization of accounts receivable at a subsidiary of Duke Energy Florida. Proceeds were used to repay short-term borrowings under the intercompany money pool borrowing arrangement and for general
corporate purposes. See Note 17 to the Consolidated Financial Statements, “Variable Interest Entities” for further details.
(e) Proceeds were used to fund a portion of Duke Energy’s prior investment in the existing Wind Star renewables portfolio.
(f) Proceeds were used to repay short-term borrowings under the intercompany money pool borrowing arrangement and for general corporate purposes.
(g) The debt is fl oating rate based on three-month LIBOR plus a fi xed credit spread of 20 basis points.
(h) Proceeds will be used to repay to redeem $450 million of tax-exempt bonds, repay short-term borrowings under the intercompany money pool borrowing arrangement and for general corporate purposes.