Duke Energy 2014 Annual Report Download - page 65
Download and view the complete annual report
Please find page 65 of the 2014 Duke Energy annual report below. You can navigate through the pages in the report by either clicking on the pages listed below, or by using the keyword search tool below to find specific information within the annual report.-
 1
1 -
2
-
3
-
4
-
5
-
6
-
7
-
8
-
9
-
10
-
11
-
12
-
13
-
14
-
15
-
16
-
17
-
18
-
19
-
20
-
21
-
22
-
23
-
24
-
25
-
26
-
27
-
28
-
29
-
30
-
31
-
32
-
33
-
34
-
35
-
36
-
37
-
38
-
39
-
40
-
41
-
42
-
43
-
44
-
45
-
46
-
47
-
48
-
49
-
50
-
51
-
52
-
53
-
54
-
 55
55 -
 56
56 -
 57
57 -
 58
58 -
 59
59 -
 60
60 -
 61
61 -
 62
62 -
 63
63 -
 64
64 -
 65
65 -
 66
66 -
 67
67 -
 68
68 -
 69
69 -
 70
70 -
 71
71 -
 72
72 -
 73
73 -
 74
74 -
 75
75 -
76
-
77
-
78
-
79
-
80
-
81
-
82
-
83
-
84
-
85
-
86
-
87
-
88
-
89
-
90
-
91
-
92
-
93
-
94
-
95
-
96
-
97
-
98
-
99
-
100
-
101
-
102
-
103
-
104
-
105
-
106
-
107
-
108
-
109
-
110
-
111
-
112
-
113
-
114
-
115
-
116
-
117
-
118
-
119
-
120
-
121
-
122
-
123
-
124
-
125
-
126
-
127
-
128
-
129
-
130
-
131
-
132
-
133
-
134
-
135
-
136
-
137
-
138
-
139
-
140
-
141
-
142
-
143
-
144
-
145
-
146
-
147
-
148
-
149
-
150
-
151
-
152
-
153
-
154
-
155
-
156
-
157
-
158
-
159
-
160
-
161
-
162
-
163
-
164
-
165
-
166
-
167
-
168
-
169
-
170
-
171
-
172
-
173
-
174
-
175
-
176
-
177
-
178
-
179
-
180
-
181
-
182
-
183
-
184
-
185
-
186
-
187
-
188
-
189
-
190
-
191
-
192
-
193
-
194
-
195
-
196
-
197
-
198
-
199
-
200
-
201
-
202
-
203
-
204
-
205
-
206
-
207
-
208
-
209
-
210
-
211
-
212
-
213
-
214
-
215
-
216
-
217
-
218
-
219
-
220
-
221
-
222
-
223
-
224
-
225
-
226
-
227
-
228
-
229
-
230
-
231
-
232
-
233
-
234
-
235
-
236
-
237
-
238
-
239
-
240
-
241
-
242
-
243
-
244
-
245
-
246
-
247
-
248
-
249
-
250
-
251
-
252
-
253
-
254
-
255
-
256
-
257
-
258
-
259
-
260
-
261
-
262
-
263
-
264
 |
 |

45
PART II
• A $64 million increase in regulated fuel expense driven primarily by
higher fuel costs and increased volumes.
Partially offset by:
• A $30 million decrease in operating and maintenance expenses primarily
due to lower corporate governance costs;
• A $16 million decrease in nonregulated fuel expense for the Beckjord
station driven by lower cost of coal from decreased production as units
have been retired; and
• An $8 million decrease in property and other taxes driven primarily by an
Ohio gas excise tax settlement in 2014.
Interest Expense. The increase was primarily due to higher regulated
average debt balances in 2014 compared to 2013 and higher intercompany
interest expense related to the funds loaned from Cinergy to Duke Energy
Commercial Asset Management, Inc. (DECAM).
Income Tax Expense. The effective tax rate for the years ended December
31, 2014 and 2013 was 38.9 percent and 39.1 percent, respectively.
Discontinued Operations, Net of Tax. The variance was primarily due to
the impairment recognized for the nonregulated Midwest generation business.
Matters Impacting Future Results
On February 17, 2014, Duke Energy Ohio announced it had initiated a
process to exit its nonregulated Midwest generation business. Duke Energy
Ohio expects to dispose of the nonregulated Midwest generation business in
the second quarter of 2015. Duke Energy Ohio recognized a pretax impairment
charge of $886 million for the year ended December 31, 2014, which represents
the excess of the carrying value over the estimated fair value of the business
based on the transaction price included in the PSA, less estimated costs to sell.
The transaction is expected to close by the end of the second quarter of 2015
and the impairment will be updated, if necessary, based on the fi nal sales price,
after any adjustments at closing for working capital and capital expenditures.
In 2013, a FERC Administrative Law Judge issued an initial decision that
Duke Energy Ohio is responsible for costs associated with certain MVP costs,
a type of MTEP cost, approved by MISO prior to the date of Duke Energy Ohio’s
withdrawal. The initial decision will be reviewed by FERC. If FERC upholds the
initial decision, Duke Energy Ohio intends to fi le an appeal in federal court.
If Duke Energy Ohio is deemed responsible for these costs, and if a portion
of these costs are not eligible for recovery, there may be an adverse impact
to its fi nancial position, results of operations and cash fl ows. See Note 4 to
the Consolidated Financial Statements, “Regulatory Matters,” for additional
information.
DUKE ENERGY INDIANA
Introduction
Management’s Discussion and Analysis should be read in conjunction with
the accompanying Consolidated Financial Statements and Notes for the years
ended December 31, 2014, 2013 and 2012.
Basis of Presentation
The results of operations and variance discussion for Duke Energy
Indiana is presented in a reduced disclosure format in accordance with General
Instruction (I)(2)(a) of Form 10-K.
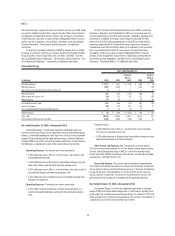
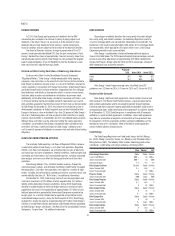
Results of Operations
Years Ended December 31,
(in millions) 2014 2013 Variance
Operating Revenues $3,175 $ 2,926 $ 249
Operating Expenses 2,470 2,193 277
Operating Income (Loss) 705 733 (28)
Other Income and Expense, net 22 18 4
Interest Expense 171 170 1
Income (Loss) Before Income Taxes 556 581 (25)
Income Tax Expense (Benefi t) 197 223 (26)
Net Income (Loss) $ 359 $ 358 $ 1
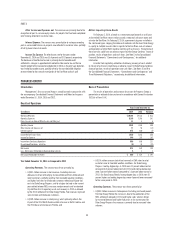
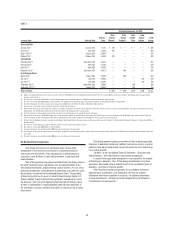
The following table shows the percent changes in GWh sales and average number of customers for Duke Energy Indiana. The below percentages for retail
customer classes represent billed sales only. Total sales includes billed and unbilled retail sales, and wholesale sales to incorporated municipalities and to public and
private utilities and power marketers. Amounts are not weather normalized.
Increase (decrease) over prior year 2014 2013
Residential sales 2.1% 3.2%
General service sales —% 0.5%
Industrial sales 2.5% (0.3)%
Wholesale power sales (8.8)% (1.4)%
Total sales (0.8)% 0.4%
Average number of customers 0.6% 0.7%