Duke Energy 2014 Annual Report Download - page 72
Download and view the complete annual report
Please find page 72 of the 2014 Duke Energy annual report below. You can navigate through the pages in the report by either clicking on the pages listed below, or by using the keyword search tool below to find specific information within the annual report.-
 1
1 -
2
-
3
-
4
-
5
-
6
-
7
-
8
-
9
-
10
-
11
-
12
-
13
-
14
-
15
-
16
-
17
-
18
-
19
-
20
-
21
-
22
-
23
-
24
-
25
-
26
-
27
-
28
-
29
-
30
-
31
-
32
-
33
-
34
-
35
-
36
-
37
-
38
-
39
-
40
-
41
-
42
-
43
-
44
-
45
-
46
-
47
-
48
-
49
-
50
-
51
-
52
-
53
-
54
-
55
-
56
-
57
-
58
-
59
-
60
-
61
-
 62
62 -
 63
63 -
 64
64 -
 65
65 -
 66
66 -
 67
67 -
 68
68 -
 69
69 -
 70
70 -
 71
71 -
 72
72 -
 73
73 -
 74
74 -
 75
75 -
 76
76 -
 77
77 -
 78
78 -
 79
79 -
 80
80 -
 81
81 -
 82
82 -
83
-
84
-
85
-
86
-
87
-
88
-
89
-
90
-
91
-
92
-
93
-
94
-
95
-
96
-
97
-
98
-
99
-
100
-
101
-
102
-
103
-
104
-
105
-
106
-
107
-
108
-
109
-
110
-
111
-
112
-
113
-
114
-
115
-
116
-
117
-
118
-
119
-
120
-
121
-
122
-
123
-
124
-
125
-
126
-
127
-
128
-
129
-
130
-
131
-
132
-
133
-
134
-
135
-
136
-
137
-
138
-
139
-
140
-
141
-
142
-
143
-
144
-
145
-
146
-
147
-
148
-
149
-
150
-
151
-
152
-
153
-
154
-
155
-
156
-
157
-
158
-
159
-
160
-
161
-
162
-
163
-
164
-
165
-
166
-
167
-
168
-
169
-
170
-
171
-
172
-
173
-
174
-
175
-
176
-
177
-
178
-
179
-
180
-
181
-
182
-
183
-
184
-
185
-
186
-
187
-
188
-
189
-
190
-
191
-
192
-
193
-
194
-
195
-
196
-
197
-
198
-
199
-
200
-
201
-
202
-
203
-
204
-
205
-
206
-
207
-
208
-
209
-
210
-
211
-
212
-
213
-
214
-
215
-
216
-
217
-
218
-
219
-
220
-
221
-
222
-
223
-
224
-
225
-
226
-
227
-
228
-
229
-
230
-
231
-
232
-
233
-
234
-
235
-
236
-
237
-
238
-
239
-
240
-
241
-
242
-
243
-
244
-
245
-
246
-
247
-
248
-
249
-
250
-
251
-
252
-
253
-
254
-
255
-
256
-
257
-
258
-
259
-
260
-
261
-
262
-
263
-
264
 |
 |

52
PART II
Credit ratings are intended to provide credit lenders a framework for
comparing the credit quality of securities and are not a recommendation to buy,
sell or hold. The Duke Energy Registrants’ credit ratings are dependent on the
rating agencies’ assessments of their ability to meet their debt principal and
interest obligations when they come due. If, as a result of market conditions
or other factors, the Duke Energy Registrants are unable to maintain current
balance sheet strength, or if earnings and cash fl ow outlook materially
deteriorates, credit ratings could be negatively impacted.
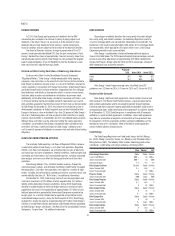
Cash Flow Information
The following table summarizes Duke Energy’s cash fl ows for the three
most recently completed fi scal years.
(in millions)
Years Ended December 31,
2014 2013 2012
Cash fl ows provided by (used in):
Operating activities $ 6,586 $ 6,382 $ 5,244
Investing activities (5,373) (4,978) (6,197)
Financing activities (678) (1,327)267
Net increase (decrease) in cash and cash
equivalents 535 77 (686)
Cash and cash equivalents at beginning of period 1,501 1,424 2,110
Cash and cash equivalents at end of period $ 2,036 $ 1,501 $ 1,424
OPERATING CASH FLOWS
The following table summarizes key components of Duke Energy’s
operating cash fl ows for the three most recently completed fi scal year.
(in millions)
Years Ended December 31,
2014 2013 2012
Net income $ 1,889 $ 2,676 $ 1,782
Non-cash adjustments to net income 5,366 4,876 3,769
Contributions to qualifi ed pension plans —(250) (304)
Working capital (669) (920) (3)
Net cash provided by operating activities $ 6,586 $ 6,382 $ 5,244
For the year ended December 31, 2014 compared to 2013, the variance
was driven primarily by:
• A $204 million increase due to prior year contributions to qualifi ed
pension plans, favorable retail pricing and rate riders and favorable
weather, partially offset by current year under collection of fuel and
purchased power costs and timing of cash payments for operations and
maintenance expenses.
For the year ended December 31, 2013 compared to 2012, the variance
was driven primarily by:
• A $2,001 million increase in net income after non-cash adjustments,
mainly due to the inclusion of Progress Energy’s results for fi rst six
months of 2013 and the impact of revised rates and lower operation and
maintenance expenses, partially offset by;
• A $917 million decrease in operating cash fl ows from increased
investments in traditional working capital, mainly due to the timing of
receivables and accruals, lower incentive accruals, net of current year
payments and reserve reductions and the prior year overallocation of the
Carolinas’ fuels costs. These decreases were partially offset by the NEIL
proceeds.
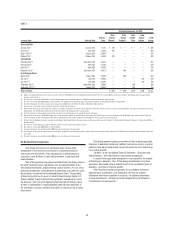
INVESTING CASH FLOWS
The following table summarizes key components of Duke Energy’s
investing cash fl ows for the three most recently completed fi scal years.
(in millions)
Years Ended December 31,
2014 2013 2012
Capital, investment and acquisition expenditures $ (5,528) $ (5,607) $ (5,958)
Available-for-sale securities, net 23 173 (182)
Proceeds from sales of equity investments and
other assets, and sales of and collections on
notes receivable 179 277 212
Other investing items (47) 179 (269)
Net cash used in investing activities $ (5,373) $ (4,978) $ (6,197)
The primary use of cash related to investing activities is capital,
investment and acquisition expenditures, detailed by reportable business
segment in the following table.
(in millions)
Years Ended December 31,
2014 2013 2012
Regulated Utilities $ 4,744 $ 5,049 $ 4,220
Commercial Power 67 268 1,038
International Energy 555 67 551
Other 162 223 149
Total capital, investment and acquisition
expenditures $ 5,528 $ 5,607 $ 5,958
For the year ended December 31, 2014 compared to 2013, the variance
was driven primarily by:
• A $192 million return of collateral related to the Chilean hydro
acquisition in 2013 and
• A $150 million decrease in net proceeds from sales and maturities of
available-for-sale securities, net of purchases.
For the year ended December 31, 2013 compared to 2012, the variance
was driven primarily by:
• A $581 million variance in restricted cash due to posting collateral on a
secured debt issuance related to the Chilean hydro acquisition in 2012
and the return of a portion of this collateral in 2013,
• A $355 million increase in proceeds from the sales of available-for-sale
securities, net of purchases due to the investment of excess cash held
in foreign jurisdictions and
• A $351 million decrease in capital, investment and acquisition
expenditures primarily due to lower spending on Duke Energy’s
renewable energy projects and ongoing infrastructure modernization
program as these projects were completed, net of expenditures on
Progress Energy’s maintenance projects.