Duke Energy 2014 Annual Report Download - page 185
Download and view the complete annual report
Please find page 185 of the 2014 Duke Energy annual report below. You can navigate through the pages in the report by either clicking on the pages listed below, or by using the keyword search tool below to find specific information within the annual report.-
 1
1 -
2
-
3
-
4
-
5
-
6
-
7
-
8
-
9
-
10
-
11
-
12
-
13
-
14
-
15
-
16
-
17
-
18
-
19
-
20
-
21
-
22
-
23
-
24
-
25
-
26
-
27
-
28
-
29
-
30
-
31
-
32
-
33
-
34
-
35
-
36
-
37
-
38
-
39
-
40
-
41
-
42
-
43
-
44
-
45
-
46
-
47
-
48
-
49
-
50
-
51
-
52
-
53
-
54
-
55
-
56
-
57
-
58
-
59
-
60
-
61
-
62
-
63
-
64
-
65
-
66
-
67
-
68
-
69
-
70
-
71
-
72
-
73
-
74
-
75
-
76
-
77
-
78
-
79
-
80
-
81
-
82
-
83
-
84
-
85
-
86
-
87
-
88
-
89
-
90
-
91
-
92
-
93
-
94
-
95
-
96
-
97
-
98
-
99
-
100
-
101
-
102
-
103
-
104
-
105
-
106
-
107
-
108
-
109
-
110
-
111
-
112
-
113
-
114
-
115
-
116
-
117
-
118
-
119
-
120
-
121
-
122
-
123
-
124
-
125
-
126
-
127
-
128
-
129
-
130
-
131
-
132
-
133
-
134
-
135
-
136
-
137
-
138
-
139
-
140
-
141
-
142
-
143
-
144
-
145
-
146
-
147
-
148
-
149
-
150
-
151
-
152
-
153
-
154
-
155
-
156
-
157
-
158
-
159
-
160
-
161
-
162
-
163
-
164
-
165
-
166
-
167
-
168
-
169
-
170
-
171
-
172
-
173
-
174
-
 175
175 -
 176
176 -
 177
177 -
 178
178 -
 179
179 -
 180
180 -
 181
181 -
 182
182 -
 183
183 -
 184
184 -
 185
185 -
 186
186 -
 187
187 -
 188
188 -
 189
189 -
 190
190 -
 191
191 -
 192
192 -
 193
193 -
 194
194 -
 195
195 -
196
-
197
-
198
-
199
-
200
-
201
-
202
-
203
-
204
-
205
-
206
-
207
-
208
-
209
-
210
-
211
-
212
-
213
-
214
-
215
-
216
-
217
-
218
-
219
-
220
-
221
-
222
-
223
-
224
-
225
-
226
-
227
-
228
-
229
-
230
-
231
-
232
-
233
-
234
-
235
-
236
-
237
-
238
-
239
-
240
-
241
-
242
-
243
-
244
-
245
-
246
-
247
-
248
-
249
-
250
-
251
-
252
-
253
-
254
-
255
-
256
-
257
-
258
-
259
-
260
-
261
-
262
-
263
-
264
 |
 |

165
PART II
DUKE ENERGY CORPORATION • DUKE ENERGY CAROLINAS, LLC • PROGRESS ENERGY, INC. •
DUKE ENERGY PROGRESS, INC. • DUKE ENERGY FLORIDA, INC. • DUKE ENERGY OHIO, INC. • DUKE ENERGY INDIANA, INC.
Combined Notes to Consolidated Financial Statements – (Continued)
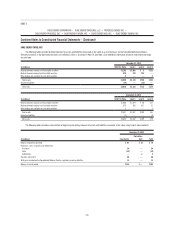
PROGRESS ENERGY
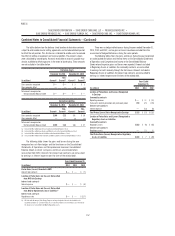
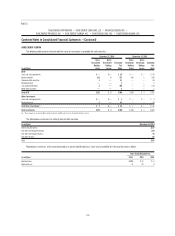
The following table presents the estimated fair value of investments in available-for-sale securities.
December 31, 2014 December 31, 2013
(in millions)
Gross
Unrealized
Holding
Gains
Gross
Unrealized
Holding
Losses
Estimated
Fair
Value
Gross
Unrealized
Holding
Gains
Gross
Unrealized
Holding
Losses
Estimated
Fair
Value
NDTF
Cash and cash equivalents $— $— $ 85 $— $— $ 68
Equity securities 824 12 1,488 839 4 1,615
Corporate debt securities 6 — 138 3 1 126
Municipal bonds 4 — 122 2 4 106
U.S. government bonds 12 1 670 4 5 376
Other debt securities ——14——8
Total NDTF $846 $ 13 $ 2,517 $848 $ 14 $2,299
Other Investments
Cash and cash equivalents ——15——20
Municipal bonds 3—43 1—39
Total Other Investments(a) $3 $— $ 58 $1 $— $ 59
Total Investments $849 $ 13 $ 2,575 $849 $ 14 $2,358
(a) These amounts are recorded in Other within Investments and Other Assets on the Consolidated Balance Sheets.
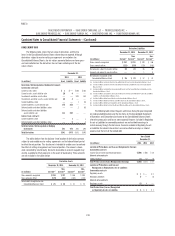
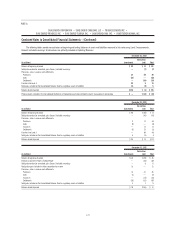
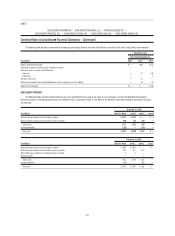
The table below summarizes the maturity date for debt securities.
(in millions) December 31, 2014
Due in one year or less $161
Due after one through fi ve years 350
Due after fi ve through 10 years 157
Due after 10 years 319
Total $987
Realized gains and losses, which were determined on a specifi c identifi cation basis, from sales of available-for-sale securities were as follows.
Years Ended December 31,
(in millions) 2014 2013 2012
Realized gains $157 $90 $34
Realized losses 11 46 18