Duke Energy 2014 Annual Report Download - page 54
Download and view the complete annual report
Please find page 54 of the 2014 Duke Energy annual report below. You can navigate through the pages in the report by either clicking on the pages listed below, or by using the keyword search tool below to find specific information within the annual report.-
 1
1 -
2
-
3
-
4
-
5
-
6
-
7
-
8
-
9
-
10
-
11
-
12
-
13
-
14
-
15
-
16
-
17
-
18
-
19
-
20
-
21
-
22
-
23
-
24
-
25
-
26
-
27
-
28
-
29
-
30
-
31
-
32
-
33
-
34
-
35
-
36
-
37
-
38
-
39
-
40
-
41
-
42
-
43
-
 44
44 -
 45
45 -
 46
46 -
 47
47 -
 48
48 -
 49
49 -
 50
50 -
 51
51 -
 52
52 -
 53
53 -
 54
54 -
 55
55 -
 56
56 -
 57
57 -
 58
58 -
 59
59 -
 60
60 -
 61
61 -
 62
62 -
 63
63 -
 64
64 -
65
-
66
-
67
-
68
-
69
-
70
-
71
-
72
-
73
-
74
-
75
-
76
-
77
-
78
-
79
-
80
-
81
-
82
-
83
-
84
-
85
-
86
-
87
-
88
-
89
-
90
-
91
-
92
-
93
-
94
-
95
-
96
-
97
-
98
-
99
-
100
-
101
-
102
-
103
-
104
-
105
-
106
-
107
-
108
-
109
-
110
-
111
-
112
-
113
-
114
-
115
-
116
-
117
-
118
-
119
-
120
-
121
-
122
-
123
-
124
-
125
-
126
-
127
-
128
-
129
-
130
-
131
-
132
-
133
-
134
-
135
-
136
-
137
-
138
-
139
-
140
-
141
-
142
-
143
-
144
-
145
-
146
-
147
-
148
-
149
-
150
-
151
-
152
-
153
-
154
-
155
-
156
-
157
-
158
-
159
-
160
-
161
-
162
-
163
-
164
-
165
-
166
-
167
-
168
-
169
-
170
-
171
-
172
-
173
-
174
-
175
-
176
-
177
-
178
-
179
-
180
-
181
-
182
-
183
-
184
-
185
-
186
-
187
-
188
-
189
-
190
-
191
-
192
-
193
-
194
-
195
-
196
-
197
-
198
-
199
-
200
-
201
-
202
-
203
-
204
-
205
-
206
-
207
-
208
-
209
-
210
-
211
-
212
-
213
-
214
-
215
-
216
-
217
-
218
-
219
-
220
-
221
-
222
-
223
-
224
-
225
-
226
-
227
-
228
-
229
-
230
-
231
-
232
-
233
-
234
-
235
-
236
-
237
-
238
-
239
-
240
-
241
-
242
-
243
-
244
-
245
-
246
-
247
-
248
-
249
-
250
-
251
-
252
-
253
-
254
-
255
-
256
-
257
-
258
-
259
-
260
-
261
-
262
-
263
-
264
 |
 |

34
PART II
customers and job training in accordance with 2013 North Carolina
Utilities Commission (NCUC) and Public Service Commission of
South Carolina (PSCSC) rate case orders.
Partially offset by:
• A $346 million decrease due to the 2013 impairment and other charges
primarily related to Crystal River Unit 3 and the proposed Levy Nuclear
Station (Levy). See Note 4 to the Consolidated Financial Statements,
“Regulatory Matters,” for additional information;
• A $42 million decrease in property and other taxes primarily due to the
termination of the collection of the North Carolina gross receipts tax as
mentioned above; partially offset by a sales tax reserve as a result of an
Indiana sales tax audit, and higher property taxes; and
• A $22 million decrease due to the 2013 impairment resulting from the
decision to suspend the application for two proposed nuclear units at
Shearon Harris Nuclear Station (Harris).
Other Income and Expenses, net. The variance is primarily due to
recognition of post in-service equity returns for projects that had been completed
prior to being refl ected in customer rates, partially offset by lower AFUDC –
equity, primarily due to placing the Sutton plant into service in late 2013.
Interest Expense. The variance was primarily due to no longer recording
post in-service debt returns on projects now refl ected in customer rates and
a reduction in debt return on the Crystal River Unit 3 regulatory asset now
recovered through fuel revenues.
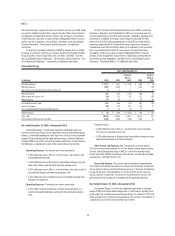
Income Tax Expense. The variance was primarily due to higher pretax
income and partially offset by a lower effective tax rate of 36.8 percent
compared to 37.8 percent, respectively, for the years ended December 31, 2014
and 2013. The decrease in effective tax rate is primarily due to favorable audit
settlements, a higher manufacturing deduction due to prior year limitations
based on taxable income, and changes in income apportionment for state income
tax, partially offset by the non-deductible litigation reserve related to the criminal
investigation of the Dan River coal ash spill.
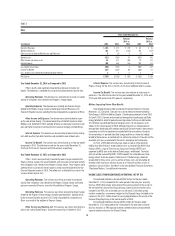
Year Ended December 31, 2013 as Compared to 2012
Regulated Utilities’ results were positively impacted by 2012 impairment
and other charges related to the Edwardsport Integrated Gasifi cation Combined
Cycle (IGCC) plant, higher retail pricing and rate riders, the inclusion of Progress
Energy results for the fi rst six months of 2013, a net increase in wholesale
power revenues, and higher weather-normal sales volumes. These impacts were
partially offset by higher income tax expense, Crystal River Unit 3 charges, lower
AFUDC – equity and higher depreciation and amortization expense. The following
is a detailed discussion of the variance drivers by line item.
Operating Revenues. The variance was driven primarily by:
• A $4,339 million increase due to the inclusion of Progress Energy for the
fi rst six months of 2013;
• A $434 million net increase in retail pricing primarily due to revised
rates approved in all jurisdictions;
• A $76 million net increase in wholesale power revenues, net of sharing,
primarily due to additional volumes and charges for capacity for
customers served under long-term contracts; and
• A $72 million increase in weather-normal sales volumes to retail
customers (net of fuel revenue) refl ecting increased demand.
Partially offset by:
• A $132 million decrease in fuel revenues (including emission allowances)
driven primarily by (i) the impact of lower Florida residential fuel rates,
including amortization associated with the settlement agreement
approved by the Florida Public Service Commission (FPSC) in 2012
(2012 Settlement), (ii) lower fuel rates for electric retail customers in the
Carolinas, Florida and Ohio, and (iii) lower revenues for purchased power,
partially offset by (iv) increased demand from electric retail customers.
Fuel revenues represent sales to retail and wholesale customers.
Operating Expenses. The variance was driven primarily by:
• A $3,393 million increase due to the inclusion of Progress Energy for the
fi rst six months of 2013;
• A $346 million increase in impairment and other charges in 2013
primarily related to Crystal River Unit 3 and Levy; and
• A $102 million increase in depreciation and amortization expense
primarily due to a decrease in the reduction of the cost of removal
component of amortization expense as allowed under the 2012
Settlement.
Partially offset by:
• A $600 million decrease due to 2012 impairment and other charges
related to the Edwardsport IGCC plant. See Note 4 to the Consolidated
Financial Statements, “Regulatory Matters,” for additional information,
and
• A $120 million decrease in fuel expense (including purchased power and
natural gas purchases for resale) primarily related to (i) the application
of the NEIL settlement proceeds in Florida, including amortization
associated with the 2012 Settlement; (ii) lower purchased power costs
in (a) the Carolinas, primarily due to additional generating capacity
placed in service in late 2012 and market conditions, (b) Ohio, primarily
due to reduced sales volumes, and (c) Indiana, refl ective of market
conditions; partially offset by (iii) higher volumes of natural gas used in
electric generation due primarily to additional generating capacity placed
in service; (iv) higher prices for natural gas and coal used in electric
generation; and (v) higher volumes of coal used in electric generation
primarily due to generation mix.
Other Income and Expenses, net. The decrease is primarily due to lower
AFUDC equity, resulting from major projects that were placed into service in late
2012 and the implementation of new customer rates related to the IGCC rider,
partially offset by the inclusion of Progress Energy for the fi rst six months of 2013.
Interest Expense. The variance was primarily driven by the inclusion of
Progress Energy for the fi rst six months of 2013.
Income Tax Expense. The variance was primarily due to an increase in
pretax income. The effective tax rates for the years ended December 31, 2013
and 2012 were 37.8 percent and 35 percent, respectively. The increase in
the effective tax rate was primarily due to an increase in pretax income and a
reduction in AFUDC equity.
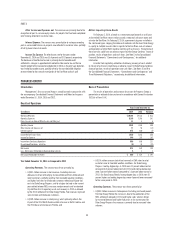
Matters Impacting Future Regulated Utilities Results
On February 2, 2014, a break in a stormwater pipe beneath an ash basin
at the retired Dan River steam station caused a release of ash basin water and
ash into the Dan River. On February 8, 2014, a permanent plug was installed in