Duke Energy 2014 Annual Report Download - page 60
Download and view the complete annual report
Please find page 60 of the 2014 Duke Energy annual report below. You can navigate through the pages in the report by either clicking on the pages listed below, or by using the keyword search tool below to find specific information within the annual report.-
 1
1 -
2
-
3
-
4
-
5
-
6
-
7
-
8
-
9
-
10
-
11
-
12
-
13
-
14
-
15
-
16
-
17
-
18
-
19
-
20
-
21
-
22
-
23
-
24
-
25
-
26
-
27
-
28
-
29
-
30
-
31
-
32
-
33
-
34
-
35
-
36
-
37
-
38
-
39
-
40
-
41
-
42
-
43
-
44
-
45
-
46
-
47
-
48
-
49
-
 50
50 -
 51
51 -
 52
52 -
 53
53 -
 54
54 -
 55
55 -
 56
56 -
 57
57 -
 58
58 -
 59
59 -
 60
60 -
 61
61 -
 62
62 -
 63
63 -
 64
64 -
 65
65 -
 66
66 -
 67
67 -
 68
68 -
 69
69 -
 70
70 -
71
-
72
-
73
-
74
-
75
-
76
-
77
-
78
-
79
-
80
-
81
-
82
-
83
-
84
-
85
-
86
-
87
-
88
-
89
-
90
-
91
-
92
-
93
-
94
-
95
-
96
-
97
-
98
-
99
-
100
-
101
-
102
-
103
-
104
-
105
-
106
-
107
-
108
-
109
-
110
-
111
-
112
-
113
-
114
-
115
-
116
-
117
-
118
-
119
-
120
-
121
-
122
-
123
-
124
-
125
-
126
-
127
-
128
-
129
-
130
-
131
-
132
-
133
-
134
-
135
-
136
-
137
-
138
-
139
-
140
-
141
-
142
-
143
-
144
-
145
-
146
-
147
-
148
-
149
-
150
-
151
-
152
-
153
-
154
-
155
-
156
-
157
-
158
-
159
-
160
-
161
-
162
-
163
-
164
-
165
-
166
-
167
-
168
-
169
-
170
-
171
-
172
-
173
-
174
-
175
-
176
-
177
-
178
-
179
-
180
-
181
-
182
-
183
-
184
-
185
-
186
-
187
-
188
-
189
-
190
-
191
-
192
-
193
-
194
-
195
-
196
-
197
-
198
-
199
-
200
-
201
-
202
-
203
-
204
-
205
-
206
-
207
-
208
-
209
-
210
-
211
-
212
-
213
-
214
-
215
-
216
-
217
-
218
-
219
-
220
-
221
-
222
-
223
-
224
-
225
-
226
-
227
-
228
-
229
-
230
-
231
-
232
-
233
-
234
-
235
-
236
-
237
-
238
-
239
-
240
-
241
-
242
-
243
-
244
-
245
-
246
-
247
-
248
-
249
-
250
-
251
-
252
-
253
-
254
-
255
-
256
-
257
-
258
-
259
-
260
-
261
-
262
-
263
-
264
 |
 |

40
PART II
Other Income and Expenses, net. The variance was primarily due to the
recognition of post in-service equity returns for projects that had been completed
prior to being refl ected in customer rates.
Interest Expense. The variance was primarily due to no longer recording
post in-service debt returns on projects now refl ected in customer rates, partially
offset by lower interest on bonds.
Income Tax Expense. The effective tax rate for the years ended
December 31, 2014 and 2013 was 35.4 percent and 37.8 percent, respectively.
The decrease in the effective tax rate is primarily due to favorable audit
settlements, changes in apportionment related to state income tax and the tax
benefi t related to the manufacturing deduction in 2014 as the prior year deduction
was limited by taxable income, partially offset by the non-deductible litigation
reserve related to the criminal investigation of the Dan River coal ash spill.
Matters Impacting Future Results
On February 2, 2014, a break in a stormwater pipe beneath an ash basin
at the retired Dan River steam station caused a release of ash basin water and
ash into the Dan River. On February 8, 2014, a permanent plug was installed in
the stormwater pipe, stopping the release of materials into the river. Duke Energy
is a party to multiple lawsuits fi led in regards to the Dan River coal ash release
and operations at other North Carolina facilities with ash basins. The outcome of
these lawsuits could have an adverse impact to Duke Energy Carolinas’ fi nancial
position, results of operations and cash fl ows. See Note 5 to the Consolidated
Financial Statements, “Commitments and Contingencies,” for additional
information.
An order from regulatory authorities disallowing recovery of costs related
to closure of ash basins could have an adverse impact to Duke Energy Carolinas’
fi nancial position, results of operations and cash fl ows. See Notes 5 and 9 to
the Consolidated Financial Statements, “Commitments and Contingencies” and
“Asset Retirement Obligations,” respectively, for additional information.
PROGRESS ENERGY
Introduction
Management’s Discussion and Analysis should be read in conjunction with
the accompanying Consolidated Financial Statements and Notes for the years
ended December 31, 2014, 2013 and 2012.
Basis of Presentation
The results of operations and variance discussion for Progress Energy is
presented in a reduced disclosure format in accordance with General Instruction
(I)(2)(a) of Form 10-K.
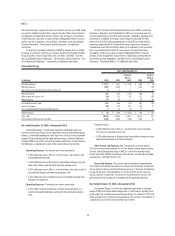
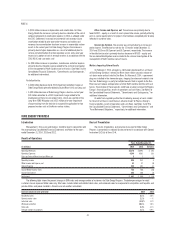
Results of Operations
Years Ended December 31,
(in millions) 2014 2013 Variance
Operating Revenues $10,166 $ 9,533 $ 633
Operating Expenses 8,159 7,918 241
Gains (Losses) on Sales of Other Assets and Other, net 11 38
Operating Income 2,018 1,618 400
Other Income and Expense, net 77 94 (17)
Interest Expense 675 680 (5)
Income Before Income Taxes 1,420 1,032 388
Income Tax Expense 540 373 167
Income from Continuing Operations 880 659 221
Discontinued Operations, net of tax (6) 16 (22)
Net Income 874 675 199
Less: Net Income Attributable to Noncontrolling Interests 532
Net Income Attributable to Parent $ 869 $ 672 $ 197
Year Ended December 31, 2014 as Compared to 2013
Operating Revenues. The variance was driven primarily by:
• A $341 million increase in fuel revenues (including emission
allowances) driven primarily by increased demand from wholesale and
retail customers, partially resulting from favorable weather conditions,
and higher fuel rates for wholesale customers refl ective of higher fuel
costs for Duke Energy Progress; and to a higher fuel rate in the current
year related to lower NEIL insurance reimbursements and accelerated
Crystal River Unit 3 regulatory asset cost recovery in 2014 as allowed
by the 2013 Settlement for Duke Energy Florida. Fuel revenues represent
sales to retail and wholesale customers;
• A $149 million increase in retail pricing, which primarily refl ects the
impact of the 2013 North Carolina retail rate case in North Carolina and
the 2014 base rate increase in Florida; and
• A $114 million increase (net of fuel revenue) in GWh sales to retail
customers due to favorable weather conditions. For Duke Energy
Progress, heating degree days in 2014 were 11 percent above normal
compared to 2 percent above normal in 2013 and cooling degree days
were 2 percent below normal compared to 13 percent below normal in
2013. For Duke Energy Florida, heating degree days in 2014 were 51
percent higher and cooling degree days were 4 percent lower compared
to the same period in 2013.
Operating Expenses. The variance was driven primarily by:
• A $344 million increase in fuel expenses (including purchased power).
For Duke Energy Florida the increase is due to the application of the
NEIL settlement proceeds in 2013 and higher sales volumes driven
by increased demand and higher fuel prices in the current year. For
Duke Energy Progress the increase is primarily due to increased sales
volumes;