Duke Energy 2014 Annual Report Download - page 71
Download and view the complete annual report
Please find page 71 of the 2014 Duke Energy annual report below. You can navigate through the pages in the report by either clicking on the pages listed below, or by using the keyword search tool below to find specific information within the annual report.-
 1
1 -
2
-
3
-
4
-
5
-
6
-
7
-
8
-
9
-
10
-
11
-
12
-
13
-
14
-
15
-
16
-
17
-
18
-
19
-
20
-
21
-
22
-
23
-
24
-
25
-
26
-
27
-
28
-
29
-
30
-
31
-
32
-
33
-
34
-
35
-
36
-
37
-
38
-
39
-
40
-
41
-
42
-
43
-
44
-
45
-
46
-
47
-
48
-
49
-
50
-
51
-
52
-
53
-
54
-
55
-
56
-
57
-
58
-
59
-
60
-
 61
61 -
 62
62 -
 63
63 -
 64
64 -
 65
65 -
 66
66 -
 67
67 -
 68
68 -
 69
69 -
 70
70 -
 71
71 -
 72
72 -
 73
73 -
 74
74 -
 75
75 -
 76
76 -
 77
77 -
 78
78 -
 79
79 -
 80
80 -
 81
81 -
82
-
83
-
84
-
85
-
86
-
87
-
88
-
89
-
90
-
91
-
92
-
93
-
94
-
95
-
96
-
97
-
98
-
99
-
100
-
101
-
102
-
103
-
104
-
105
-
106
-
107
-
108
-
109
-
110
-
111
-
112
-
113
-
114
-
115
-
116
-
117
-
118
-
119
-
120
-
121
-
122
-
123
-
124
-
125
-
126
-
127
-
128
-
129
-
130
-
131
-
132
-
133
-
134
-
135
-
136
-
137
-
138
-
139
-
140
-
141
-
142
-
143
-
144
-
145
-
146
-
147
-
148
-
149
-
150
-
151
-
152
-
153
-
154
-
155
-
156
-
157
-
158
-
159
-
160
-
161
-
162
-
163
-
164
-
165
-
166
-
167
-
168
-
169
-
170
-
171
-
172
-
173
-
174
-
175
-
176
-
177
-
178
-
179
-
180
-
181
-
182
-
183
-
184
-
185
-
186
-
187
-
188
-
189
-
190
-
191
-
192
-
193
-
194
-
195
-
196
-
197
-
198
-
199
-
200
-
201
-
202
-
203
-
204
-
205
-
206
-
207
-
208
-
209
-
210
-
211
-
212
-
213
-
214
-
215
-
216
-
217
-
218
-
219
-
220
-
221
-
222
-
223
-
224
-
225
-
226
-
227
-
228
-
229
-
230
-
231
-
232
-
233
-
234
-
235
-
236
-
237
-
238
-
239
-
240
-
241
-
242
-
243
-
244
-
245
-
246
-
247
-
248
-
249
-
250
-
251
-
252
-
253
-
254
-
255
-
256
-
257
-
258
-
259
-
260
-
261
-
262
-
263
-
264
 |
 |

51
PART II
DIVIDEND PAYMENTS
In 2014, Duke Energy paid quarterly cash dividends for the 88th
consecutive year and expects to continue its policy of paying regular cash
dividends in the future. There is no assurance as to the amount of future
dividends because they depend on future earnings, capital requirements,
fi nancial condition and are subject to the discretion of the Board of Directors.
The Board of Directors continues to target a payout ratio of 65 to 70
percent, based upon adjusted diluted EPS. Over the past several years, Duke
Energy’s dividend has grown at approximately 2 percent annually, slower than
overall adjusted earnings growth. Duke Energy has now achieved the targeted
payout range and believes it has the fl exibility to grow the dividend at a pace
more consistent with adjusted earnings growth.
Dividend and Other Funding Restrictions of Duke Energy Subsidiaries
As discussed in Note 4 to the Consolidated Financial Statements
“Regulatory Matters,” Duke Energy’s wholly owned public utility operating
companies have restrictions on the amount of funds that can be transferred to
Duke Energy via dividend, advance or loan as a result of conditions imposed by
various regulators in conjunction with merger transactions. Duke Energy Progress
and Duke Energy Florida also have restrictions imposed by their fi rst mortgage
bond indentures and Articles of Incorporation which, in certain circumstances,
limit their ability to make cash dividends or distributions on common stock.
Additionally, certain other Duke Energy subsidiaries have other restrictions, such
as minimum working capital and tangible net worth requirements pursuant to
debt and other agreements that limit the amount of funds that can be transferred
to Duke Energy. At December 31, 2014, the amount of restricted net assets of
wholly owned subsidiaries of Duke Energy that may not be distributed to Duke
Energy in the form of a loan or dividend is less than 25 percent of Duke Energy’s
net assets. Duke Energy does not have any legal or other restrictions on paying
common stock dividends to shareholders out of its consolidated equity accounts.
Although these restrictions cap the amount of funding the various operating
subsidiaries can provide to Duke Energy, management does not believe these
restrictions will have a signifi cant impact on Duke Energy’s ability to access
cash to meet its payment of dividends on common stock and other future funding
obligations.
CASH FLOWS FROM OPERATING ACTIVITIES
The relatively stable operating cash fl ows of Regulated Utilities compose
a substantial portion of Duke Energy’s cash fl ows from operations. Regulated
Utilities’ cash fl ows from operations are primarily driven by sales of electricity
and natural gas and costs of operations. Weather conditions, working capital and
commodity price fl uctuations, and unanticipated expenses, including unplanned
plant outages and storms can affect the timing and level of cash fl ows from
operations.
Duke Energy believes it has suffi cient liquidity resources through the
commercial paper markets, and ultimately, the Master Credit Facility, to support
these operations. Cash fl ows from operations are subject to a number of other
factors, including, but not limited to, regulatory constraints, economic trends and
market volatility (see Item 1A, “Risk Factors,” for additional information).
At December 31, 2014, Duke Energy had cash and cash equivalents and
short-term investments of $2.0 billion, of which approximately $1.7 billion is
held by entities domiciled in foreign jurisdictions. During 2014, Duke Energy
declared a taxable dividend of historical foreign earnings in the form of notes
payable that will result in the repatriation of approximately $2.7 billion of cash
held and expected to be generated by International Energy over a period of up
to eight years. As a result of the decision to repatriate all cumulative historic
undistributed foreign earnings, during the fourth quarter of 2014, Duke Energy
recorded U.S. income tax expense of approximately $373 million. Duke Energy’s
intention is to indefi nitely reinvest prospective undistributed earnings generated
by Duke Energy’s foreign subsidiaries. See Note 22 to the Consolidated Financial
Statements, “Income Taxes,” for additional information.
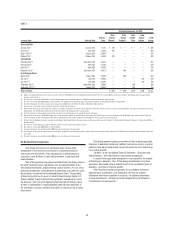
DEBT ISSUANCES
Depending on availability based on the issuing entity, the credit rating of
the issuing entity, and market conditions, the Subsidiary Registrants prefer to
issue fi rst mortgage bonds and secured debt, followed by unsecured debt. This
preference is the result of generally higher credit ratings for fi rst mortgage bonds
and secured debt, which typically result in lower interest costs. Duke Energy
Corporation primarily issues unsecured debt.
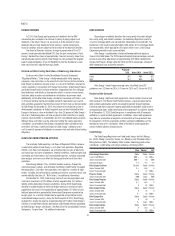
Duke Energy’s capitalization is balanced between debt and equity as
shown in the table below. The 2015 projected capitalization percentages exclude
purchase accounting adjustments of approximately $2.9 billion related to the
merger with Progress Energy, while the 2014 and 2013 percentages include all
debt-related purchase accounting amounts.
Projected
2015 Actual 2014 Actual 2013
Equity 50 % 49 % 50 %
Debt 50 % 51% 50 %
Duke Energy’s fi xed charges coverage ratio, calculated using SEC
guidelines, was 3.2 times for 2014, 3.0 times for 2013 and 2.4 times for 2012.
Restrictive Debt Covenants
Duke Energy’s debt and credit agreements contain various fi nancial and
other covenants. The Master Credit Facility contains a covenant requiring the
debt-to-total capitalization ratio to not exceed 65 percent for each borrower.
Failure to meet those covenants beyond applicable grace periods could result in
accelerated due dates and/or termination of the agreements or sublimits thereto.
As of December 31, 2014, Duke Energy was in compliance with all covenants
related to its signifi cant debt agreements. In addition, some credit agreements
may allow for acceleration of payments or termination of the agreements due
to nonpayment, or to the acceleration of other signifi cant indebtedness of the
borrower or some of its subsidiaries. None of the debt or credit agreements
contain material adverse change clauses.
Credit Ratings
The Duke Energy Registrants each hold credit ratings by Fitch Ratings,
Inc. (Fitch), Moody’s Investors Service, Inc. (Moody’s) and Standard & Poor’s
Rating Services (S&P). The following table includes Duke Energy and certain
subsidiaries’ credit ratings and ratings outlook as of February 2015.
Fitch Moody’s S&P
Duke Energy Corporation Stable Stable Positive
Issuer Credit Rating BBB+ A3 BBB+
Senior Unsecured Debt BBB+ A3 BBB
Commercial Paper F-2 P-2 A-2
Duke Energy Carolinas Positive Stable Positive
Senior Secured Debt A+ Aa2 A
Senior Unsecured Debt A A1 BBB+
Progress Energy Stable Stable Positive
Senior Unsecured Debt BBB Baa1 BBB
Duke Energy Progress Stable Stable Positive
Senior Secured Debt A+ Aa2 A
Senior Unsecured Debt A A1 BBB+
Duke Energy Florida Stable Stable Positive
Senior Secured Debt A A1 A
Senior Unsecured Debt A- A3 BBB+
Duke Energy Ohio Stable Stable Positive
Senior Secured Debt A A2 A
Senior Unsecured Debt A- Baa1 BBB+
Duke Energy Indiana Stable Stable Positive
Senior Secured Debt A Aa3 A
Senior Unsecured Debt A- A2 BBB+