Duke Energy 2014 Annual Report Download - page 59
Download and view the complete annual report
Please find page 59 of the 2014 Duke Energy annual report below. You can navigate through the pages in the report by either clicking on the pages listed below, or by using the keyword search tool below to find specific information within the annual report.-
 1
1 -
2
-
3
-
4
-
5
-
6
-
7
-
8
-
9
-
10
-
11
-
12
-
13
-
14
-
15
-
16
-
17
-
18
-
19
-
20
-
21
-
22
-
23
-
24
-
25
-
26
-
27
-
28
-
29
-
30
-
31
-
32
-
33
-
34
-
35
-
36
-
37
-
38
-
39
-
40
-
41
-
42
-
43
-
44
-
45
-
46
-
47
-
48
-
 49
49 -
 50
50 -
 51
51 -
 52
52 -
 53
53 -
 54
54 -
 55
55 -
 56
56 -
 57
57 -
 58
58 -
 59
59 -
 60
60 -
 61
61 -
 62
62 -
 63
63 -
 64
64 -
 65
65 -
 66
66 -
 67
67 -
 68
68 -
 69
69 -
70
-
71
-
72
-
73
-
74
-
75
-
76
-
77
-
78
-
79
-
80
-
81
-
82
-
83
-
84
-
85
-
86
-
87
-
88
-
89
-
90
-
91
-
92
-
93
-
94
-
95
-
96
-
97
-
98
-
99
-
100
-
101
-
102
-
103
-
104
-
105
-
106
-
107
-
108
-
109
-
110
-
111
-
112
-
113
-
114
-
115
-
116
-
117
-
118
-
119
-
120
-
121
-
122
-
123
-
124
-
125
-
126
-
127
-
128
-
129
-
130
-
131
-
132
-
133
-
134
-
135
-
136
-
137
-
138
-
139
-
140
-
141
-
142
-
143
-
144
-
145
-
146
-
147
-
148
-
149
-
150
-
151
-
152
-
153
-
154
-
155
-
156
-
157
-
158
-
159
-
160
-
161
-
162
-
163
-
164
-
165
-
166
-
167
-
168
-
169
-
170
-
171
-
172
-
173
-
174
-
175
-
176
-
177
-
178
-
179
-
180
-
181
-
182
-
183
-
184
-
185
-
186
-
187
-
188
-
189
-
190
-
191
-
192
-
193
-
194
-
195
-
196
-
197
-
198
-
199
-
200
-
201
-
202
-
203
-
204
-
205
-
206
-
207
-
208
-
209
-
210
-
211
-
212
-
213
-
214
-
215
-
216
-
217
-
218
-
219
-
220
-
221
-
222
-
223
-
224
-
225
-
226
-
227
-
228
-
229
-
230
-
231
-
232
-
233
-
234
-
235
-
236
-
237
-
238
-
239
-
240
-
241
-
242
-
243
-
244
-
245
-
246
-
247
-
248
-
249
-
250
-
251
-
252
-
253
-
254
-
255
-
256
-
257
-
258
-
259
-
260
-
261
-
262
-
263
-
264
 |
 |

39
PART II
DUKE ENERGY CAROLINAS
Introduction
Management’s Discussion and Analysis should be read in conjunction with
the accompanying Consolidated Financial Statements and Notes for the years
ended December 31, 2014, 2013 and 2012.
Basis of Presentation
The results of operations and variance discussion for Duke Energy
Carolinas is presented in a reduced disclosure format in accordance with
General Instruction (I)(2)(a) of Form 10-K.
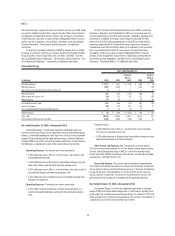
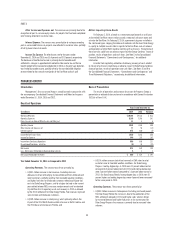
Results of Operations
Years Ended December 31,
(in millions) 2014 2013 Variance
Operating Revenues $7,351 $ 6,954 $ 397
Operating Expenses 5,456 5,145 311
Operating Income 1,895 1,809 86
Other Income and Expense, net 172 120 52
Interest Expense 407 359 48
Income Before Income Taxes 1,660 1,570 90
Income Tax Expense 588 594 (6)
Net Income $1,072 $ 976 $ 96
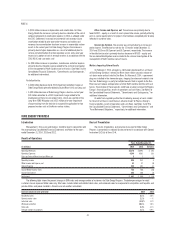
The following table shows the percent changes in GWh sales and average number of customers for Duke Energy Carolinas. The below percentages for retail
customer classes represent billed sales only. Total sales includes billed and unbilled retail sales, and wholesale sales to incorporated municipalities and to public and
private utilities and power marketers. Amounts are not weather normalized.
Increase (decrease) over prior year 2014 2013
Residential sales 4.0% 2.3%
General service sales 2.4% 1.0%
Industrial sales 2.4% 0.4%
Wholesale and other (4.7)% 62.1%
Total sales 2.2% 5.4%
Average number of customers 1.0% 0.7%
Year Ended December 31, 2014 as Compared to 2013
Operating Revenues. The variance was driven primarily by:
• A $180 million increase in retail pricing and updated rate riders,
which primarily refl ects the impact of the 2013 North Carolina and
South Carolina retail rate cases;
• A $151 million increase in fuel revenues driven primarily by increased
demand from retail customers, mainly due to favorable weather
conditions. Fuel revenues represent sales to retail and wholesale
customers;
• A $99 million increase in electric sales (net of fuel revenues) to retail
customers due to favorable weather conditions. Heating degree days in
2014 were 11 percent above normal compared to 5 percent above normal
during the same period in 2013 and cooling degree days were 6 percent
below normal as compared to 17 percent below normal in 2013;
• A $19 million increase in wholesale power revenues, net of sharing,
primarily due to new customers; and
• An $18 million increase in weather-normal sales volumes to retail
customers refl ecting increased demand.
Partially offset by:
• A $79 million decrease in gross receipts tax revenue due to the North
Carolina Tax Simplifi cation and Rate Reduction Act which terminated the
collection of the North Carolina gross receipts tax effective July 1, 2014.
Operating Expenses. The variance was driven primarily by:
• A $151 million increase in fuel expense (including purchased power)
primarily due to increased retail demand resulting from favorable
weather conditions;
• A $127 million increase in operating and maintenance expenses
primarily due to a litigation reserve related to the criminal investigation
of the Dan River coal ash spill (See Note 5 to the Consolidated Financial
Statements, “Commitments and Contingencies,” for additional
information), repairs and remediation expenses associated with the Dan
River coal ash discharge and other ash basin related assessment costs,
higher non-outage costs at generation plants, higher storm costs, higher
distribution costs, higher nuclear outage expense including the impacts
of nuclear levelization, and higher energy effi ciency program costs,
partially offset by decreased corporate costs and lower costs associated
with the Progress Energy merger; and
• An $88 million increase in depreciation and amortization primarily
due to higher depreciation as a result of additional plant in service
and amortization of certain regulatory assets, partially offset by lower
depreciation expense due to reductions for costs of removal in accordance
with the 2013 North Carolina and South Carolina rate case orders.
Partially offset by:
• A $58 million decrease in property and other tax expenses primarily
due to lower revenue related taxes driven by the elimination of
North Carolina gross receipts tax effective July 1, 2014, partially offset
by higher property tax expense.