Duke Energy 2014 Annual Report Download - page 211
Download and view the complete annual report
Please find page 211 of the 2014 Duke Energy annual report below. You can navigate through the pages in the report by either clicking on the pages listed below, or by using the keyword search tool below to find specific information within the annual report.-
 1
1 -
2
-
3
-
4
-
5
-
6
-
7
-
8
-
9
-
10
-
11
-
12
-
13
-
14
-
15
-
16
-
17
-
18
-
19
-
20
-
21
-
22
-
23
-
24
-
25
-
26
-
27
-
28
-
29
-
30
-
31
-
32
-
33
-
34
-
35
-
36
-
37
-
38
-
39
-
40
-
41
-
42
-
43
-
44
-
45
-
46
-
47
-
48
-
49
-
50
-
51
-
52
-
53
-
54
-
55
-
56
-
57
-
58
-
59
-
60
-
61
-
62
-
63
-
64
-
65
-
66
-
67
-
68
-
69
-
70
-
71
-
72
-
73
-
74
-
75
-
76
-
77
-
78
-
79
-
80
-
81
-
82
-
83
-
84
-
85
-
86
-
87
-
88
-
89
-
90
-
91
-
92
-
93
-
94
-
95
-
96
-
97
-
98
-
99
-
100
-
101
-
102
-
103
-
104
-
105
-
106
-
107
-
108
-
109
-
110
-
111
-
112
-
113
-
114
-
115
-
116
-
117
-
118
-
119
-
120
-
121
-
122
-
123
-
124
-
125
-
126
-
127
-
128
-
129
-
130
-
131
-
132
-
133
-
134
-
135
-
136
-
137
-
138
-
139
-
140
-
141
-
142
-
143
-
144
-
145
-
146
-
147
-
148
-
149
-
150
-
151
-
152
-
153
-
154
-
155
-
156
-
157
-
158
-
159
-
160
-
161
-
162
-
163
-
164
-
165
-
166
-
167
-
168
-
169
-
170
-
171
-
172
-
173
-
174
-
175
-
176
-
177
-
178
-
179
-
180
-
181
-
182
-
183
-
184
-
185
-
186
-
187
-
188
-
189
-
190
-
191
-
192
-
193
-
194
-
195
-
196
-
197
-
198
-
199
-
200
-
 201
201 -
 202
202 -
 203
203 -
 204
204 -
 205
205 -
 206
206 -
 207
207 -
 208
208 -
 209
209 -
 210
210 -
 211
211 -
 212
212 -
 213
213 -
 214
214 -
 215
215 -
 216
216 -
 217
217 -
 218
218 -
 219
219 -
 220
220 -
 221
221 -
222
-
223
-
224
-
225
-
226
-
227
-
228
-
229
-
230
-
231
-
232
-
233
-
234
-
235
-
236
-
237
-
238
-
239
-
240
-
241
-
242
-
243
-
244
-
245
-
246
-
247
-
248
-
249
-
250
-
251
-
252
-
253
-
254
-
255
-
256
-
257
-
258
-
259
-
260
-
261
-
262
-
263
-
264
 |
 |

191
PART II
DUKE ENERGY CORPORATION • DUKE ENERGY CAROLINAS, LLC • PROGRESS ENERGY, INC. •
DUKE ENERGY PROGRESS, INC. • DUKE ENERGY FLORIDA, INC. • DUKE ENERGY OHIO, INC. • DUKE ENERGY INDIANA, INC.
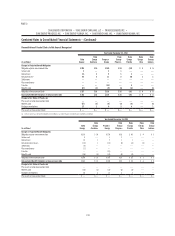
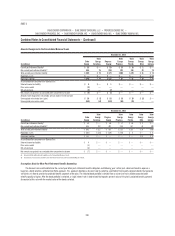
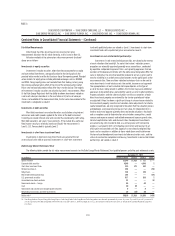
Combined Notes to Consolidated Financial Statements – (Continued)
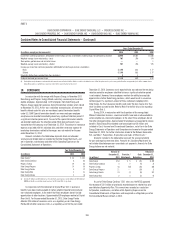
As of December 31, 2013, none of the qualifi ed pension plans had an accumulated benefi t obligation in excess of plan assets.
Assumptions Used for Pension Benefi ts Accounting
The discount rate used to determine the current year pension obligation and following year’s pension expense is based on a bond selection-settlement portfolio
approach. This approach develops a discount rate by selecting a portfolio of high quality corporate bonds that generate suffi cient cash fl ow to provide for projected
benefi t payments of the plan. The selected bond portfolio is derived from a universe of non-callable corporate bonds rated Aa quality or higher. After the bond portfolio
is selected, a single interest rate is determined that equates the present value of the plan’s projected benefi t payments discounted at this rate with the market value
of the bonds selected.
The average remaining service period of active covered employees is nine years for Duke Energy, Duke Energy Carolinas, Progress Energy, Duke Energy Progress,
Duke Energy Florida, Duke Energy Ohio and Duke Energy Indiana.
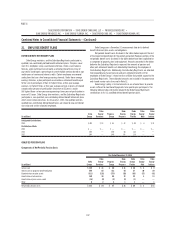
The following tables present the assumptions or range of assumptions used for pension benefi t accounting.
December 31,
2014 2013 2012(a)
Benefi t Obligations
Discount rate 4.10% 4.70 % 4.10%
Salary increase 4.00% - 4.40% 4.00% - 4.40 % 4.00% - 4.30%
Net Periodic Benefi t Cost
Discount rate 4.70% 4.10 % 4.60% - 5.10%
Salary increase 4.00% - 4.40% 4.00% - 4.30 % 4.00% - 4.40%
Expected long-term rate of return on plan assets 6.75% 7.75 % 8.00% - 8.25%
(a) For Progress Energy plans, the assumptions used in 2012 to determine net periodic pension costs refl ect remeasurement as of July 1, 2012, due to the merger between Duke Energy and Progress Energy.
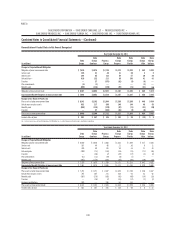
Expected Benefi t Payments
(in millions)
Duke
Energy
Duke
Energy
Carolinas
Progress
Energy
Duke
Energy
Progress
Duke
Energy
Florida
Duke
Energy
Ohio
Duke
Energy
Indiana
Years ending December 31,
2015 $ 584 $ 175 $ 150 $ 80 $ 67 $ 34 $ 45
2016 604 184 158 85 70 35 46
2017 616 195 161 86 73 34 45
2018 625 200 165 87 76 34 46
2019 626 194 168 88 78 34 46
2020 – 2024 3,107 924 868 437 420 168 229
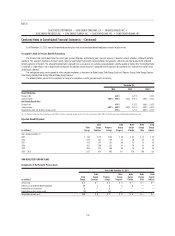
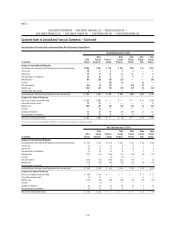
NON-QUALIFIED PENSION PLANS
Components of Net Periodic Pension Costs
Year Ended December 31, 2014
(in millions)
Duke
Energy
Duke
Energy
Carolinas
Progress
Energy
Duke
Energy
Progress
Duke
Energy
Florida
Duke
Energy
Ohio
Duke
Energy
Indiana
Service cost $3 $— $1 $ 1 $— $— $—
Interest cost on projected benefi t obligation 14 1 5 1 2 — —
Amortization of actuarial loss 3 — 2 — — — —
Amortization of prior service credit (1) — (1) — — — —
Net periodic pension costs $19 $ 1 $ 7 $ 2 $ 2 $— $—