Duke Energy 2014 Annual Report Download - page 137
Download and view the complete annual report
Please find page 137 of the 2014 Duke Energy annual report below. You can navigate through the pages in the report by either clicking on the pages listed below, or by using the keyword search tool below to find specific information within the annual report.-
 1
1 -
2
-
3
-
4
-
5
-
6
-
7
-
8
-
9
-
10
-
11
-
12
-
13
-
14
-
15
-
16
-
17
-
18
-
19
-
20
-
21
-
22
-
23
-
24
-
25
-
26
-
27
-
28
-
29
-
30
-
31
-
32
-
33
-
34
-
35
-
36
-
37
-
38
-
39
-
40
-
41
-
42
-
43
-
44
-
45
-
46
-
47
-
48
-
49
-
50
-
51
-
52
-
53
-
54
-
55
-
56
-
57
-
58
-
59
-
60
-
61
-
62
-
63
-
64
-
65
-
66
-
67
-
68
-
69
-
70
-
71
-
72
-
73
-
74
-
75
-
76
-
77
-
78
-
79
-
80
-
81
-
82
-
83
-
84
-
85
-
86
-
87
-
88
-
89
-
90
-
91
-
92
-
93
-
94
-
95
-
96
-
97
-
98
-
99
-
100
-
101
-
102
-
103
-
104
-
105
-
106
-
107
-
108
-
109
-
110
-
111
-
112
-
113
-
114
-
115
-
116
-
117
-
118
-
119
-
120
-
121
-
122
-
123
-
124
-
125
-
126
-
 127
127 -
 128
128 -
 129
129 -
 130
130 -
 131
131 -
 132
132 -
 133
133 -
 134
134 -
 135
135 -
 136
136 -
 137
137 -
 138
138 -
 139
139 -
 140
140 -
 141
141 -
 142
142 -
 143
143 -
 144
144 -
 145
145 -
 146
146 -
 147
147 -
148
-
149
-
150
-
151
-
152
-
153
-
154
-
155
-
156
-
157
-
158
-
159
-
160
-
161
-
162
-
163
-
164
-
165
-
166
-
167
-
168
-
169
-
170
-
171
-
172
-
173
-
174
-
175
-
176
-
177
-
178
-
179
-
180
-
181
-
182
-
183
-
184
-
185
-
186
-
187
-
188
-
189
-
190
-
191
-
192
-
193
-
194
-
195
-
196
-
197
-
198
-
199
-
200
-
201
-
202
-
203
-
204
-
205
-
206
-
207
-
208
-
209
-
210
-
211
-
212
-
213
-
214
-
215
-
216
-
217
-
218
-
219
-
220
-
221
-
222
-
223
-
224
-
225
-
226
-
227
-
228
-
229
-
230
-
231
-
232
-
233
-
234
-
235
-
236
-
237
-
238
-
239
-
240
-
241
-
242
-
243
-
244
-
245
-
246
-
247
-
248
-
249
-
250
-
251
-
252
-
253
-
254
-
255
-
256
-
257
-
258
-
259
-
260
-
261
-
262
-
263
-
264
 |
 |

117
PART II
DUKE ENERGY CORPORATION • DUKE ENERGY CAROLINAS, LLC • PROGRESS ENERGY, INC. •
DUKE ENERGY PROGRESS, INC. • DUKE ENERGY FLORIDA, INC. • DUKE ENERGY OHIO, INC. • DUKE ENERGY INDIANA, INC.
Combined Notes to Consolidated Financial Statements – (Continued)
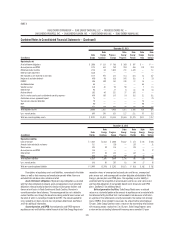
DUKE ENERGY OHIO
Duke Energy Ohio has two reportable operating segments, Regulated
Utilities and Commercial Power.
Regulated Utilities transmits and distributes electricity in portions of Ohio
and generates, distributes and sells electricity in portions of Kentucky. Regulated
Utilities also transports and sells natural gas in portions of Ohio and northern
Kentucky. It conducts operations primarily through Duke Energy Ohio and its
wholly owned subsidiary, Duke Energy Kentucky.
As discussed in Note 2, Duke Energy entered into an agreement to sell
Commercial Power’s nonregulated Midwest generation business to Dynegy
in a transaction that is expected to close in the second quarter of 2015. As a
result of this divestiture, the results of operations of the nonregulated Midwest
generation business have been reclassifi ed to Discontinued Operations on the
Consolidated Statements of Operations and Comprehensive Income. Amounts
remaining in Commercial Power relate to assets not included in the Disposal
Group. Certain costs such as interest and general and administrative expenses
previously allocated to the Disposal Group were not reclassifi ed to discontinued
operations.
The remainder of Duke Energy Ohio’s operations is presented as Other.
While it is not considered an operating segment, Other primarily includes
certain governance costs allocated by its parent, Duke Energy. See Note 13
for additional information. All of Duke Energy Ohio’s revenues are generated
domestically and its long-lived assets are all in the U.S.
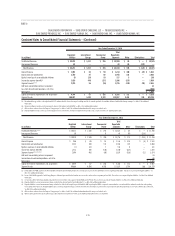
Year Ended December 31, 2014
(in millions)
Regulated
Utilities
Commercial
Power
Total
Reportable
Segments Other Eliminations Total
Unaffi liated revenues $ 1,894 $ 19 $ 1,913 $ — $ — $ 1,913
Intersegment revenues 1 — 1 — (1) —
Total revenues $ 1,895 $ 19 $ 1,914 $ — $ (1) $ 1,913
Interest expense $ 81 $ 5 $ 86 $ — $ — $ 86
Depreciation and amortization 211 2 213 1 — 214
Income tax expense (benefi t) 117 (67) 50 (7) — 43
Segment income (loss)(a) 202 (121) 81 (13) — 68
Income from discontinued operations, net of tax (563)
Net loss $ (495)
Capital expenditures $ 300 $ 22 $ 322 $ — $ — $ 322
Segment assets 6,908 3,187 10,095 134 (230) 9,999
(a) Commercial Power recorded a pretax impairment charge of $94 million related to OVEC. See Note 11 for additional information.
Year Ended December 31, 2013
(in millions)
Regulated
Utilities
Commercial
Power
Total
Reportable
Segments Other Eliminations Total
Unaffi liated revenues $ 1,765 $ 40 $ 1,805 $ — $ — $ 1,805
Total revenues $ 1,765 $ 40 $ 1,805 $ — $ — $ 1,805
Interest expense $ 74 $ — $ 74 $ — $ — $ 74
Depreciation and amortization 200 13 213 — — 213
Income tax expense (benefi t) 91 (36) 55 (12) — 43
Segment income (loss) 151 (65) 86 (19) — 67
Income from discontinued operations, net of tax 35
Net income $ 102
Capital expenditures $ 375 $ 58 $ 433 $ — $ — $ 433
Segment assets 6,649 4,170 10,819 99 (155) 10,763