Duke Energy 2014 Annual Report Download - page 131
Download and view the complete annual report
Please find page 131 of the 2014 Duke Energy annual report below. You can navigate through the pages in the report by either clicking on the pages listed below, or by using the keyword search tool below to find specific information within the annual report.-
 1
1 -
2
-
3
-
4
-
5
-
6
-
7
-
8
-
9
-
10
-
11
-
12
-
13
-
14
-
15
-
16
-
17
-
18
-
19
-
20
-
21
-
22
-
23
-
24
-
25
-
26
-
27
-
28
-
29
-
30
-
31
-
32
-
33
-
34
-
35
-
36
-
37
-
38
-
39
-
40
-
41
-
42
-
43
-
44
-
45
-
46
-
47
-
48
-
49
-
50
-
51
-
52
-
53
-
54
-
55
-
56
-
57
-
58
-
59
-
60
-
61
-
62
-
63
-
64
-
65
-
66
-
67
-
68
-
69
-
70
-
71
-
72
-
73
-
74
-
75
-
76
-
77
-
78
-
79
-
80
-
81
-
82
-
83
-
84
-
85
-
86
-
87
-
88
-
89
-
90
-
91
-
92
-
93
-
94
-
95
-
96
-
97
-
98
-
99
-
100
-
101
-
102
-
103
-
104
-
105
-
106
-
107
-
108
-
109
-
110
-
111
-
112
-
113
-
114
-
115
-
116
-
117
-
118
-
119
-
120
-
 121
121 -
 122
122 -
 123
123 -
 124
124 -
 125
125 -
 126
126 -
 127
127 -
 128
128 -
 129
129 -
 130
130 -
 131
131 -
 132
132 -
 133
133 -
 134
134 -
 135
135 -
 136
136 -
 137
137 -
 138
138 -
 139
139 -
 140
140 -
 141
141 -
142
-
143
-
144
-
145
-
146
-
147
-
148
-
149
-
150
-
151
-
152
-
153
-
154
-
155
-
156
-
157
-
158
-
159
-
160
-
161
-
162
-
163
-
164
-
165
-
166
-
167
-
168
-
169
-
170
-
171
-
172
-
173
-
174
-
175
-
176
-
177
-
178
-
179
-
180
-
181
-
182
-
183
-
184
-
185
-
186
-
187
-
188
-
189
-
190
-
191
-
192
-
193
-
194
-
195
-
196
-
197
-
198
-
199
-
200
-
201
-
202
-
203
-
204
-
205
-
206
-
207
-
208
-
209
-
210
-
211
-
212
-
213
-
214
-
215
-
216
-
217
-
218
-
219
-
220
-
221
-
222
-
223
-
224
-
225
-
226
-
227
-
228
-
229
-
230
-
231
-
232
-
233
-
234
-
235
-
236
-
237
-
238
-
239
-
240
-
241
-
242
-
243
-
244
-
245
-
246
-
247
-
248
-
249
-
250
-
251
-
252
-
253
-
254
-
255
-
256
-
257
-
258
-
259
-
260
-
261
-
262
-
263
-
264
 |
 |

111
PART II
DUKE ENERGY CORPORATION • DUKE ENERGY CAROLINAS, LLC • PROGRESS ENERGY, INC. •
DUKE ENERGY PROGRESS, INC. • DUKE ENERGY FLORIDA, INC. • DUKE ENERGY OHIO, INC. • DUKE ENERGY INDIANA, INC.
Combined Notes to Consolidated Financial Statements – (Continued)
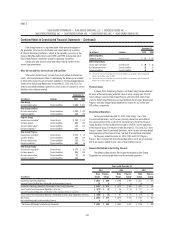
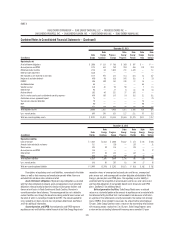
Purchase Price
Total consideration transferred was based on the closing price of Duke
Energy common shares on July 2, 2012, and was calculated as shown in the
following table.
(dollars in millions, except per share amounts; shares in thousands)
Progress Energy common shares outstanding at July 2, 2012 296,116
Exchange ratio 0.87083
Duke Energy common shares issued for Progress Energy common shares
outstanding
257,867
Closing price of Duke Energy common shares on July 2, 2012 $ 69.84
Purchase price for common stock $ 18,009
Fair value of outstanding earned stock compensation awards 62
Total purchase price $ 18,071
Progress Energy’s stock-based compensation awards, including
performance shares and restricted stock, were replaced with Duke Energy
awards upon consummation of the merger. In accordance with accounting
guidance for business combinations, a portion of the fair value of these awards
is included in the purchase price as it represents consideration transferred in
the merger.
Purchase Price Allocation
Fair value of assets acquired and liabilities assumed was determined
based on signifi cant estimates and assumptions, including Level 3 inputs,
which are judgmental in nature. Estimates and assumptions include the
projected timing and amount of future cash fl ows, discount rates refl ecting risk
inherent in future cash fl ows, and future market prices.
Additionally, the February 5, 2013 announcement of the decision to
retire Crystal River Unit 3 refl ected additional information related to facts and
circumstances existing as of the acquisition date. See Note 4 for additional
information related to Crystal River Unit 3. As such, Duke Energy presents
assets acquired and liabilities assumed as if the retirement of Crystal River
Unit 3 occurred on the acquisition date.
The majority of Progress Energy’s operations are subject to the rate-
setting authority of the FERC, NCUC, PSCSC, and FPSC and are accounted
for pursuant to U.S. GAAP, including the accounting guidance for regulated
operations. Rate-setting and cost recovery provisions currently in place for
Progress Energy’s regulated operations provide revenues derived from costs,
including a return on investment of assets and liabilities included in rate base.
Except for long-term debt, asset retirement obligations, capital leases, pension
and other post-retirement benefi t obligations (OPEB), and the wholesale
portion of Crystal River Unit 3, fair values of tangible and intangible assets and
liabilities subject to these rate-setting provisions approximate their carrying
values. Accordingly, assets acquired and liabilities assumed and pro forma
fi nancial information do not refl ect any net adjustments related to these
amounts. The difference between fair value and pre-merger carrying amounts
for long-term debt, asset retirement obligations, capital leases and pension and
OPEB plans for regulated operations were recorded as Regulatory assets.
The excess of purchase price over estimated fair values of assets
acquired and liabilities assumed was recognized as goodwill at the acquisition
date. The goodwill refl ects the value paid primarily for long-term potential
for enhanced access to capital as a result of increased scale and diversity,
opportunities for synergies, and an improved risk profi le. Goodwill resulting from
the merger was allocated entirely to the Regulated Utilities segment. None of
the goodwill recognized is deductible for income tax purposes, and as such, no
deferred taxes have been recorded related to goodwill.
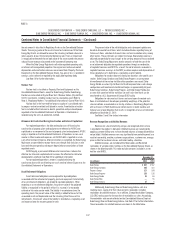
The completed purchase price allocation is presented in the following table.
(in millions)
Current assets $ 3,204
Property, plant and equipment 23,141
Goodwill 12,469
Other long-term assets 9,990
Total assets 48,804
Current liabilities, including current maturities of long-term debt 3,593
Long-term liabilities, preferred stock and noncontrolling interests 10,394
Long-term debt 16,746
Total liabilities and preferred stock 30,733
Total purchase price $ 18,071
The purchase price allocation in the table above refl ects refi nements
made to preliminary fair values of assets acquired and liabilities assumed as
of December 31, 2012. These refi nements include adjustments associated
with the retirement of Crystal River Unit 3. The changes resulted in an increase
to Goodwill of $2 million, an increase to the fair value of Current liabilities,
including current maturities of long-term debt of $12 million, a decrease to
Property, plant and equipment of $138 million, a decrease to Other long-term
assets of $4 million and a decrease to long-term liabilities, preferred stock
and noncontrolling interests of $152 million. These refi nements had no impact
on the amortization of purchase accounting adjustments recorded to earnings
during the year ended December 31, 2013, or for the six months ended
December 31, 2012.
Pro Forma Financial Information
The following unaudited pro forma fi nancial information refl ects the
consolidated results of operations of Duke Energy and the amortization of
purchase price adjustments assuming the merger had taken place on January
1, 2012. The unaudited pro forma fi nancial information has been presented for
illustrative purposes only and is not necessarily indicative of the consolidated
results of operations that would have been achieved or future consolidated
results of operations of Duke Energy.
Non-recurring merger consummation, integration and other costs incurred
by Duke Energy and Progress Energy during the period have been excluded
from pro forma earnings presented below. After-tax non-recurring merger
consummation, integration and other costs incurred by both Duke Energy and
Progress Energy were $413 million for the year ended 2012. The pro forma
fi nancial information also excludes potential future cost savings or non-
recurring charges related to the merger.
(in millions, except per share amounts)
Year Ended
December 31, 2012
Revenues $ 23,976
Net Income Attributable to Duke Energy Corporation 2,417
Basic and Diluted Earnings Per Share 3.43