Duke Energy 2014 Annual Report Download - page 116
Download and view the complete annual report
Please find page 116 of the 2014 Duke Energy annual report below. You can navigate through the pages in the report by either clicking on the pages listed below, or by using the keyword search tool below to find specific information within the annual report.-
 1
1 -
2
-
3
-
4
-
5
-
6
-
7
-
8
-
9
-
10
-
11
-
12
-
13
-
14
-
15
-
16
-
17
-
18
-
19
-
20
-
21
-
22
-
23
-
24
-
25
-
26
-
27
-
28
-
29
-
30
-
31
-
32
-
33
-
34
-
35
-
36
-
37
-
38
-
39
-
40
-
41
-
42
-
43
-
44
-
45
-
46
-
47
-
48
-
49
-
50
-
51
-
52
-
53
-
54
-
55
-
56
-
57
-
58
-
59
-
60
-
61
-
62
-
63
-
64
-
65
-
66
-
67
-
68
-
69
-
70
-
71
-
72
-
73
-
74
-
75
-
76
-
77
-
78
-
79
-
80
-
81
-
82
-
83
-
84
-
85
-
86
-
87
-
88
-
89
-
90
-
91
-
92
-
93
-
94
-
95
-
96
-
97
-
98
-
99
-
100
-
101
-
102
-
103
-
104
-
105
-
 106
106 -
 107
107 -
 108
108 -
 109
109 -
 110
110 -
 111
111 -
 112
112 -
 113
113 -
 114
114 -
 115
115 -
 116
116 -
 117
117 -
 118
118 -
 119
119 -
 120
120 -
 121
121 -
 122
122 -
 123
123 -
 124
124 -
 125
125 -
 126
126 -
127
-
128
-
129
-
130
-
131
-
132
-
133
-
134
-
135
-
136
-
137
-
138
-
139
-
140
-
141
-
142
-
143
-
144
-
145
-
146
-
147
-
148
-
149
-
150
-
151
-
152
-
153
-
154
-
155
-
156
-
157
-
158
-
159
-
160
-
161
-
162
-
163
-
164
-
165
-
166
-
167
-
168
-
169
-
170
-
171
-
172
-
173
-
174
-
175
-
176
-
177
-
178
-
179
-
180
-
181
-
182
-
183
-
184
-
185
-
186
-
187
-
188
-
189
-
190
-
191
-
192
-
193
-
194
-
195
-
196
-
197
-
198
-
199
-
200
-
201
-
202
-
203
-
204
-
205
-
206
-
207
-
208
-
209
-
210
-
211
-
212
-
213
-
214
-
215
-
216
-
217
-
218
-
219
-
220
-
221
-
222
-
223
-
224
-
225
-
226
-
227
-
228
-
229
-
230
-
231
-
232
-
233
-
234
-
235
-
236
-
237
-
238
-
239
-
240
-
241
-
242
-
243
-
244
-
245
-
246
-
247
-
248
-
249
-
250
-
251
-
252
-
253
-
254
-
255
-
256
-
257
-
258
-
259
-
260
-
261
-
262
-
263
-
264
 |
 |

96
PART II
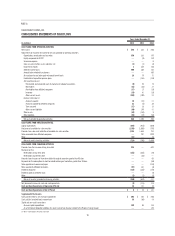
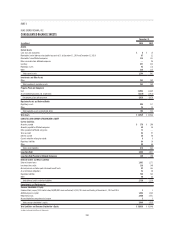
Years Ended December 31,
(in millions) 2014 2013 2012
CASH FLOWS FROM OPERATING ACTIVITIES
Net (loss) income $ (495) $ 102 $ 175
Adjustments to reconcile net (loss) income to net cash provided by operating activities:
Depreciation and amortization 258 357 342
Equity component of AFUDC (4) (1) (6)
Gains on sales of other assets and other, net (1) (5) (7)
Impairment charges 941 52
Deferred income taxes (219)98 61
Accrued pension and other post-retirement benefi t costs 817 11
(Increase) decrease in
Net realized and unrealized mark-to-market and hedging transactions 27 17 (5)
Receivables (56) (15) 29
Receivables from affi liated companies 14 (39) 61
Inventory 8(3) 15
Other current assets (5) (1) (62)
Increase (decrease) in
Accounts payable 27 13 5
Accounts payable to affi liated companies (3) 15 (22)
Taxes accrued (9) 1 (24)
Other current liabilities 27 14 (21)
Other assets (4) (6) 6
Other liabilities (33) (73) (116)
Net cash provided by operating activities 481 496 444
CASH FLOWS FROM INVESTING ACTIVITIES
Capital expenditures (322) (434) (514)
Net proceeds from the sales of other assets —11 82
Notes receivable from affi liated companies (88) (56) 400
Other (12)1 6
Net cash used in investing activities (422) (478) (26)
CASH FLOWS FROM FINANCING ACTIVITIES
Proceeds from the issuance of long-term debt —450 —
Payments for the redemption of long-term debt (449) (258) (556)
Notes payable to affi liated companies 473 (202) 245
Dividends to parent (100) — (175)
Other 1(3) —
Net cash used in fi nancing activities (75) (13) (486)
Net (decrease) increase in cash and cash equivalents (16) 5 (68)
Cash and cash equivalents at beginning of period 36 31 99
Cash and cash equivalents at end of period $20 $36 $31
Supplemental Disclosures:
Cash paid for interest, net of amount capitalized $76 $71 $93
Cash (received from) paid for income taxes (5)918
Signifi cant non-cash transactions:
Accrued capital expenditures 24 27 31
Transfer of Vermillion Generating Station to Duke Energy Indiana ——28
See Notes to Consolidated Financial Statements
DUKE ENERGY OHIO, INC.
CONSOLIDATED STATEMENTS OF CASH FLOWS