Duke Energy 2014 Annual Report Download - page 13
Download and view the complete annual report
Please find page 13 of the 2014 Duke Energy annual report below. You can navigate through the pages in the report by either clicking on the pages listed below, or by using the keyword search tool below to find specific information within the annual report.-
 1
1 -
2
-
 3
3 -
 4
4 -
 5
5 -
 6
6 -
 7
7 -
 8
8 -
 9
9 -
 10
10 -
 11
11 -
 12
12 -
 13
13 -
 14
14 -
 15
15 -
 16
16 -
 17
17 -
 18
18 -
 19
19 -
 20
20 -
 21
21 -
 22
22 -
 23
23 -
24
-
25
-
26
-
27
-
28
-
29
-
30
-
31
-
32
-
33
-
34
-
35
-
36
-
37
-
38
-
39
-
40
-
41
-
42
-
43
-
44
-
45
-
46
-
47
-
48
-
49
-
50
-
51
-
52
-
53
-
54
-
55
-
56
-
57
-
58
-
59
-
60
-
61
-
62
-
63
-
64
-
65
-
66
-
67
-
68
-
69
-
70
-
71
-
72
-
73
-
74
-
75
-
76
-
77
-
78
-
79
-
80
-
81
-
82
-
83
-
84
-
85
-
86
-
87
-
88
-
89
-
90
-
91
-
92
-
93
-
94
-
95
-
96
-
97
-
98
-
99
-
100
-
101
-
102
-
103
-
104
-
105
-
106
-
107
-
108
-
109
-
110
-
111
-
112
-
113
-
114
-
115
-
116
-
117
-
118
-
119
-
120
-
121
-
122
-
123
-
124
-
125
-
126
-
127
-
128
-
129
-
130
-
131
-
132
-
133
-
134
-
135
-
136
-
137
-
138
-
139
-
140
-
141
-
142
-
143
-
144
-
145
-
146
-
147
-
148
-
149
-
150
-
151
-
152
-
153
-
154
-
155
-
156
-
157
-
158
-
159
-
160
-
161
-
162
-
163
-
164
-
165
-
166
-
167
-
168
-
169
-
170
-
171
-
172
-
173
-
174
-
175
-
176
-
177
-
178
-
179
-
180
-
181
-
182
-
183
-
184
-
185
-
186
-
187
-
188
-
189
-
190
-
191
-
192
-
193
-
194
-
195
-
196
-
197
-
198
-
199
-
200
-
201
-
202
-
203
-
204
-
205
-
206
-
207
-
208
-
209
-
210
-
211
-
212
-
213
-
214
-
215
-
216
-
217
-
218
-
219
-
220
-
221
-
222
-
223
-
224
-
225
-
226
-
227
-
228
-
229
-
230
-
231
-
232
-
233
-
234
-
235
-
236
-
237
-
238
-
239
-
240
-
241
-
242
-
243
-
244
-
245
-
246
-
247
-
248
-
249
-
250
-
251
-
252
-
253
-
254
-
255
-
256
-
257
-
258
-
259
-
260
-
261
-
262
-
263
-
264
 |
 |

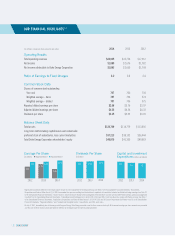
DUKE ENERGY AT A GLANCE
2014 ANNUAL REPORT / 11 /
REGULATED UTILITIES
Generation Diversity (percent owned capacity)1Generation Diversity (percent owned capacity)1
Generated (net output gigawatt-hours (GWh))2
Customer Diversity (in billed GWh sales)2
COMMERCIAL POWER
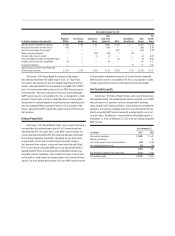
Regulated Utilities consists of Duke Energy’s regulated
generation, electric and natural gas transmission and
distribution systems. Regulated Utilities generation portfolio is
a balanced mix of energy resources having different operating
characteristics and fuel sources designed to provide energy at
the lowest possible cost.
Electric Operations
Owns approximately 49,600 megawatts (MW) of
generating capacity
Service area covers about 95,000 square miles with
an estimated population of 23 million
Service to approximately 7.3 million residential,
commercial and industrial customers
262,900 miles of distribution lines and a
32,400-mile transmission system
Natural Gas Operations
Regulated natural gas transmission and distribution services
to approximately 500,000 customers in southwestern Ohio
and northern Kentucky
Duke Energy has entered into a purchase and sale agreement
with Dynegy under which Dynegy will buy Duke Energy’s
nonregulated Midwest Commercial Generation Business, which
includes ownership interests in 11 power plants, and Duke Energy
Retail, the company’s competitive retail business in Ohio. The
transaction is expected to close by the end of the second quarter
of 2015. Commercial Power owns, operates and manages power
plants and engages in the wholesale marketing and procurement
of electric power, fuel and emission allowances related to these
plants as well as other contractual positions.
Owns and operates a balanced generation portfolio of
approximately 5,800 net MW of power generation (excluding
wind and solar generation assets)3
Duke Energy Renewables currently has more than 1,800 MW
of wind and solar energy in operation (pie chart excludes
442 MW, which are from equity investments), and has a
Na
tu
ra
l
G
as
/
Fue
l
O
i
l
38%
C
oal
1
7
%
N
uc
l
e
a
r
7%
Hydr
o
and
S
ola
r
42%
C
oa
l
33%
N
uc
l
e
a
r
2
4
%
Na
tu
ra
l
G
as/Fue
l
O
i
l
1%
Hydr
o
an
d
S
ola
r
4
4
%
Na
tu
ra
l
G
as
3
7
%
C
oal
19%
Re
n
e
wabl
e
3
4
%
Re
sid
e
n
t
ia
l
31%
G
enera
l
S
ervices
21
%
Industria
l
14
%
Wholesale/Other
1
As of December 31, 2014.
2
For the year-ended December 31, 2014.
3
The company announced in August 2014 it has agreed to sell its nonregulated Midwest Commercial Generation Business to Dynegy.
Generation Diversity (percent owned capacity)1
INTERNATIONAL ENERGY
International Energy operates and manages power generation
facilities and engages in sales and marketing of electric power
and natural gas outside the U.S. International Energy’s activities
target power generation in Latin America. International Energy
also has an equity investment in National Methanol Co., a Saudi
Arabian regional producer of MTBE, a gasoline additive.
Owns, operates or has substantial interests in approximately
4,300 net MW of generation facilities
Approximately two-thirds of International Energy’s
generating capacity is hydroelectric
7
0
%
H
y
d
r
o
2
2%
F
ue
l
Oil
6%
N
a
tu
ra
l
Gas
2
%
C
oa
l