Duke Energy 2014 Annual Report Download - page 139
Download and view the complete annual report
Please find page 139 of the 2014 Duke Energy annual report below. You can navigate through the pages in the report by either clicking on the pages listed below, or by using the keyword search tool below to find specific information within the annual report.-
 1
1 -
2
-
3
-
4
-
5
-
6
-
7
-
8
-
9
-
10
-
11
-
12
-
13
-
14
-
15
-
16
-
17
-
18
-
19
-
20
-
21
-
22
-
23
-
24
-
25
-
26
-
27
-
28
-
29
-
30
-
31
-
32
-
33
-
34
-
35
-
36
-
37
-
38
-
39
-
40
-
41
-
42
-
43
-
44
-
45
-
46
-
47
-
48
-
49
-
50
-
51
-
52
-
53
-
54
-
55
-
56
-
57
-
58
-
59
-
60
-
61
-
62
-
63
-
64
-
65
-
66
-
67
-
68
-
69
-
70
-
71
-
72
-
73
-
74
-
75
-
76
-
77
-
78
-
79
-
80
-
81
-
82
-
83
-
84
-
85
-
86
-
87
-
88
-
89
-
90
-
91
-
92
-
93
-
94
-
95
-
96
-
97
-
98
-
99
-
100
-
101
-
102
-
103
-
104
-
105
-
106
-
107
-
108
-
109
-
110
-
111
-
112
-
113
-
114
-
115
-
116
-
117
-
118
-
119
-
120
-
121
-
122
-
123
-
124
-
125
-
126
-
127
-
128
-
 129
129 -
 130
130 -
 131
131 -
 132
132 -
 133
133 -
 134
134 -
 135
135 -
 136
136 -
 137
137 -
 138
138 -
 139
139 -
 140
140 -
 141
141 -
 142
142 -
 143
143 -
 144
144 -
 145
145 -
 146
146 -
 147
147 -
 148
148 -
 149
149 -
150
-
151
-
152
-
153
-
154
-
155
-
156
-
157
-
158
-
159
-
160
-
161
-
162
-
163
-
164
-
165
-
166
-
167
-
168
-
169
-
170
-
171
-
172
-
173
-
174
-
175
-
176
-
177
-
178
-
179
-
180
-
181
-
182
-
183
-
184
-
185
-
186
-
187
-
188
-
189
-
190
-
191
-
192
-
193
-
194
-
195
-
196
-
197
-
198
-
199
-
200
-
201
-
202
-
203
-
204
-
205
-
206
-
207
-
208
-
209
-
210
-
211
-
212
-
213
-
214
-
215
-
216
-
217
-
218
-
219
-
220
-
221
-
222
-
223
-
224
-
225
-
226
-
227
-
228
-
229
-
230
-
231
-
232
-
233
-
234
-
235
-
236
-
237
-
238
-
239
-
240
-
241
-
242
-
243
-
244
-
245
-
246
-
247
-
248
-
249
-
250
-
251
-
252
-
253
-
254
-
255
-
256
-
257
-
258
-
259
-
260
-
261
-
262
-
263
-
264
 |
 |

119
PART II
DUKE ENERGY CORPORATION • DUKE ENERGY CAROLINAS, LLC • PROGRESS ENERGY, INC. •
DUKE ENERGY PROGRESS, INC. • DUKE ENERGY FLORIDA, INC. • DUKE ENERGY OHIO, INC. • DUKE ENERGY INDIANA, INC.
Combined Notes to Consolidated Financial Statements – (Continued)
4. REGULATORY MATTERS
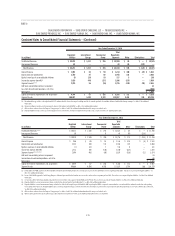
REGULATORY ASSETS AND LIABILITIES
The Duke Energy Registrants record regulatory assets and liabilities that result from the ratemaking process. See Note 1 for further information.
The following tables present the regulatory assets and liabilities recorded on the Consolidated Balance Sheets.
December 31, 2014
(in millions)
Duke
Energy
Duke
Energy
Carolinas
Progress
Energy
Duke
Energy
Progress
Duke
Energy
Florida
Duke
Energy
Ohio
Duke
Energy
Indiana
Regulatory Assets
Asset retirement obligations $ 3,017 $ 907 $1,882 $1,584 $ 298 $ — $ —
Accrued pension and OPEB 2,015 412 812 354 458 132 217
Retired generation facilities 1,659 58 1,545 152 1,393 — 56
Debt fair value adjustment 1,305 — — — — — —
Net regulatory asset related to income taxes 1,144 614 354 141 213 64 111
Hedge costs and other deferrals 628 103 490 217 273 7 28
Demand side management (DSM)/Energy effi ciency (EE) 330 106 203 193 10 21 —
Grid Modernization 76 — — — — 76 —
Vacation accrual 213 86 46 46 — 6 12
Deferred fuel 246 50 182 138 44 9 5
Nuclear deferral 296 141 155 43 112 — —
Post in-service carrying costs and deferred operating expenses 494 124 121 28 93 21 228
Gasifi cation services agreement buyout 55 — — — — — 55
Transmission expansion obligation 70 — — — — 74 —
Manufactured gas plant (MGP) 115 — — — — 115 —
Other 494 263 109 66 42 36 66
Total regulatory assets 12,157 2,864 5,899 2,962 2,936 561 778
Less: current portion 1,115 399 491 287 203 49 93
Total non-current regulatory assets $11,042 $2,465 $ 5,408 $2,675 $2,733 $512 $685
December 31, 2014
(in millions)
Duke
Energy
Duke
Energy
Carolinas
Progress
Energy
Duke
Energy
Progress
Duke
Energy
Florida
Duke
Energy
Ohio
Duke
Energy
Indiana
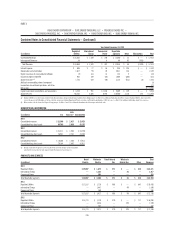
Regulatory Liabilities
Costs of removal $ 5,221 $2,420 $1,975 $1,692 $ 283 $ 222 $613
Amounts to be refunded to customers 166 — 70 — 70 — 96
Storm reserve 150 25 125 — 125 — —
Accrued pension and OPEB 379 76 121 61 60 19 91
Deferred fuel 37 6 23 23 — — 8
Other 444 217 171 127 44 10 42
Total regulatory liabilities 6,397 2,744 2,485 1,903 582 251 850
Less: current portion 204 34 106 71 35 10 54
Total non-current regulatory liabilities $ 6,193 $2,710 $2,379 $1,832 $ 547 $ 241 $ 796