Duke Energy 2014 Annual Report Download - page 53
Download and view the complete annual report
Please find page 53 of the 2014 Duke Energy annual report below. You can navigate through the pages in the report by either clicking on the pages listed below, or by using the keyword search tool below to find specific information within the annual report.-
 1
1 -
2
-
3
-
4
-
5
-
6
-
7
-
8
-
9
-
10
-
11
-
12
-
13
-
14
-
15
-
16
-
17
-
18
-
19
-
20
-
21
-
22
-
23
-
24
-
25
-
26
-
27
-
28
-
29
-
30
-
31
-
32
-
33
-
34
-
35
-
36
-
37
-
38
-
39
-
40
-
41
-
42
-
 43
43 -
 44
44 -
 45
45 -
 46
46 -
 47
47 -
 48
48 -
 49
49 -
 50
50 -
 51
51 -
 52
52 -
 53
53 -
 54
54 -
 55
55 -
 56
56 -
 57
57 -
 58
58 -
 59
59 -
 60
60 -
 61
61 -
 62
62 -
 63
63 -
64
-
65
-
66
-
67
-
68
-
69
-
70
-
71
-
72
-
73
-
74
-
75
-
76
-
77
-
78
-
79
-
80
-
81
-
82
-
83
-
84
-
85
-
86
-
87
-
88
-
89
-
90
-
91
-
92
-
93
-
94
-
95
-
96
-
97
-
98
-
99
-
100
-
101
-
102
-
103
-
104
-
105
-
106
-
107
-
108
-
109
-
110
-
111
-
112
-
113
-
114
-
115
-
116
-
117
-
118
-
119
-
120
-
121
-
122
-
123
-
124
-
125
-
126
-
127
-
128
-
129
-
130
-
131
-
132
-
133
-
134
-
135
-
136
-
137
-
138
-
139
-
140
-
141
-
142
-
143
-
144
-
145
-
146
-
147
-
148
-
149
-
150
-
151
-
152
-
153
-
154
-
155
-
156
-
157
-
158
-
159
-
160
-
161
-
162
-
163
-
164
-
165
-
166
-
167
-
168
-
169
-
170
-
171
-
172
-
173
-
174
-
175
-
176
-
177
-
178
-
179
-
180
-
181
-
182
-
183
-
184
-
185
-
186
-
187
-
188
-
189
-
190
-
191
-
192
-
193
-
194
-
195
-
196
-
197
-
198
-
199
-
200
-
201
-
202
-
203
-
204
-
205
-
206
-
207
-
208
-
209
-
210
-
211
-
212
-
213
-
214
-
215
-
216
-
217
-
218
-
219
-
220
-
221
-
222
-
223
-
224
-
225
-
226
-
227
-
228
-
229
-
230
-
231
-
232
-
233
-
234
-
235
-
236
-
237
-
238
-
239
-
240
-
241
-
242
-
243
-
244
-
245
-
246
-
247
-
248
-
249
-
250
-
251
-
252
-
253
-
254
-
255
-
256
-
257
-
258
-
259
-
260
-
261
-
262
-
263
-
264
 |
 |

33
PART II
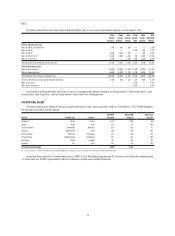
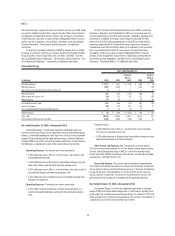
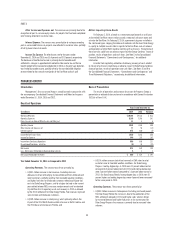
Regulated Utilities
Years Ended December 31,
(in millions) 2014 2013
Variance
2014 vs.
2013 2012
Variance
2013 vs.
2012
Operating Revenues $ 22,271 $ 20,910 $ 1,361 $ 16,080 $ 4,830
Operating Expenses 17,026 16,126 900 12,943 3,183
Gains on Sales of Other Assets and Other, net 47(3) 15 (8)
Operating Income 5,249 4,791 458 3,152 1,639
Other Income and Expense, net 267 221 46 341 (120)
Interest Expense 1,093 986 107 806 180
Income Before Income Taxes 4,423 4,026 397 2,687 1,339
Income Tax Expense 1,628 1,522 106 941 581
Less: Income Attributable to Noncontrolling Interest ——— 2 (2)
Segment Income $ 2,795 $ 2,504 $ 291 $ 1,744 $ 760
Duke Energy Carolinas’ GWh sales 87,645 85,790 1,855 81,362 4,428
Duke Energy Progress’ GWh sales(a) 62,871 60,204 2,667 58,390 1,814
Duke Energy Florida GWh sales(b) 38,703 37,974 729 38,443 (469)
Duke Energy Ohio GWh sales 24,735 24,557 178 24,344 213
Duke Energy Indiana GWh sales 33,433 33,715 (282) 33,577 138
Total Regulated Utilities GWh sales 247,387 242,240 5,147 236,116 6,124
Net proportional MW capacity in operation 49,600 49,607 (7) 49,654 (47)
(a) For Duke Energy Progress, 26,634 gigawatt-hours (GWh) sales for the year ended December 31, 2012, occurred prior to the merger between Duke Energy and Progress Energy.
(b) For Duke Energy Florida, 18,348 GWh sales for the year ended December 31, 2012, occurred prior to the merger between Duke Energy and Progress Energy.
Year Ended December 31, 2014 as Compared to 2013
Regulated Utilities’ results were positively impacted by higher retail pricing
and rate riders, favorable weather, an increase in wholesale power margins,
higher weather-normal sales volumes, and 2013 impairments and other charges.
These impacts were partially offset by higher depreciation and amortization
expense, higher operation and maintenance costs, higher interest expense, and
higher income tax expense. The following is a detailed discussion of the variance
drivers by line item.
Operating Revenues. The variance was driven primarily by:
• A $614 million increase in fuel revenues driven primarily by increased
demand from electric retail customers resulting from favorable weather
conditions, and higher fuel rates for electric retail customers for all
jurisdictions, except North Carolina. Fuel revenues represent sales to
retail and wholesale customers;
• A $556 million net increase in retail pricing primarily due to retail rate
changes and updated rate riders;
• A $216 million increase in electric sales (net of fuel revenue) to retail
customers due to more favorable weather conditions. (i) For the year
ended December 31, 2014 in the Carolinas, cooling degree days were
4 percent below normal as compared with 15 percent below normal
during the same period in 2013, and heating degree days were 11
percent above normal as compared with 4 percent above normal during
the same period in 2013. (ii) For the year ended December 31, 2014
in the Midwest, cooling degree days were 21 percent below normal as
compared with 8 percent below normal during the same period in 2013,
and heating degree days were 18 percent above normal as compared
with 7 percent above normal during the same period in 2013. (iii) For
the year ended December 31, 2014 in Florida, cooling degree days were
3 percent below normal as compared with 2 percent above normal
during the same period in 2013, and heating degree days were 4 percent
above normal as compared with 35 percent below normal during the
same period in 2013;
• A $63 million increase in wholesale power revenues, net of sharing,
primarily due to additional volumes and capacity charges for customers
served under long-term contracts; and
• A $21 million increase in weather-normal sales volumes to retail
customers (net of fuel revenue) refl ecting increased demand.
Partially offset by:
• A $139 million decrease in gross receipts tax revenue due to the North
Carolina Tax Simplifi cation and Rate Reduction Act which terminated the
collection of the North Carolina gross receipts tax effective July 1, 2014.
Operating Expenses. The variance was driven primarily by:
• A $611 million increase in fuel expense (including purchased power and
natural gas purchases for resale) primarily related to (i) higher volumes
of coal, and oil used in electric generation due primarily to increased
generation resulting from favorable weather conditions, (ii) higher natural
gas prices, and (iii) the application of the Nuclear Electric Insurance
Limited (NEIL) settlement proceeds in 2013 for Duke Energy Florida;
• A $436 million increase in depreciation and amortization expense primarily
due to increases in depreciation as a result of additional plant in service
and amortization of regulatory assets, and higher 2013 reductions to cost
of removal reserves in accordance with regulatory orders; and
• A $292 million increase in operating and maintenance expense primarily
due to a litigation reserve related to the criminal investigation of the
Dan River coal ash spill (See Note 5 to the Consolidated Financial
Statements, “Commitments and Contingencies,” for additional
information), higher storm costs, repairs and remediation expenses
associated with the Dan River coal ash discharge and other ash basin
related assessment costs, and higher nuclear costs, including nuclear
outage levelization costs, and higher environmental and operational
costs that are recoverable in rates; partially offset by a 2013 Crystal
River Unit 3 Nuclear Station (Crystal River Unit 3) related settlement
matter, decreased benefi ts costs and 2013 donations for low-income