Duke Energy 2014 Annual Report Download - page 106
Download and view the complete annual report
Please find page 106 of the 2014 Duke Energy annual report below. You can navigate through the pages in the report by either clicking on the pages listed below, or by using the keyword search tool below to find specific information within the annual report.-
 1
1 -
2
-
3
-
4
-
5
-
6
-
7
-
8
-
9
-
10
-
11
-
12
-
13
-
14
-
15
-
16
-
17
-
18
-
19
-
20
-
21
-
22
-
23
-
24
-
25
-
26
-
27
-
28
-
29
-
30
-
31
-
32
-
33
-
34
-
35
-
36
-
37
-
38
-
39
-
40
-
41
-
42
-
43
-
44
-
45
-
46
-
47
-
48
-
49
-
50
-
51
-
52
-
53
-
54
-
55
-
56
-
57
-
58
-
59
-
60
-
61
-
62
-
63
-
64
-
65
-
66
-
67
-
68
-
69
-
70
-
71
-
72
-
73
-
74
-
75
-
76
-
77
-
78
-
79
-
80
-
81
-
82
-
83
-
84
-
85
-
86
-
87
-
88
-
89
-
90
-
91
-
92
-
93
-
94
-
95
-
 96
96 -
 97
97 -
 98
98 -
 99
99 -
 100
100 -
 101
101 -
 102
102 -
 103
103 -
 104
104 -
 105
105 -
 106
106 -
 107
107 -
 108
108 -
 109
109 -
 110
110 -
 111
111 -
 112
112 -
 113
113 -
 114
114 -
 115
115 -
 116
116 -
117
-
118
-
119
-
120
-
121
-
122
-
123
-
124
-
125
-
126
-
127
-
128
-
129
-
130
-
131
-
132
-
133
-
134
-
135
-
136
-
137
-
138
-
139
-
140
-
141
-
142
-
143
-
144
-
145
-
146
-
147
-
148
-
149
-
150
-
151
-
152
-
153
-
154
-
155
-
156
-
157
-
158
-
159
-
160
-
161
-
162
-
163
-
164
-
165
-
166
-
167
-
168
-
169
-
170
-
171
-
172
-
173
-
174
-
175
-
176
-
177
-
178
-
179
-
180
-
181
-
182
-
183
-
184
-
185
-
186
-
187
-
188
-
189
-
190
-
191
-
192
-
193
-
194
-
195
-
196
-
197
-
198
-
199
-
200
-
201
-
202
-
203
-
204
-
205
-
206
-
207
-
208
-
209
-
210
-
211
-
212
-
213
-
214
-
215
-
216
-
217
-
218
-
219
-
220
-
221
-
222
-
223
-
224
-
225
-
226
-
227
-
228
-
229
-
230
-
231
-
232
-
233
-
234
-
235
-
236
-
237
-
238
-
239
-
240
-
241
-
242
-
243
-
244
-
245
-
246
-
247
-
248
-
249
-
250
-
251
-
252
-
253
-
254
-
255
-
256
-
257
-
258
-
259
-
260
-
261
-
262
-
263
-
264
 |
 |

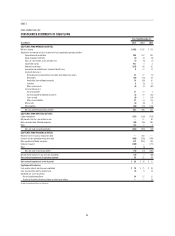
86
PART II
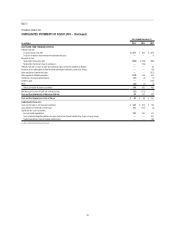
Years Ended December 31,
(in millions) 2014 2013 2012
CASH FLOWS FROM OPERATING ACTIVITIES
Net income $ 467 $ 500 $ 272
Adjustments to reconcile net income to net cash provided by operating activities:
Depreciation, amortization and accretion (including amortization of nuclear fuel) 761 685 676
Equity component of AFUDC (25) (42) (69)
Severance expense ——18
FERC mitigation costs (18) —71
Community support and charitable contributions expense —20 36
Gains on sales of other assets and other, net (3) (1) (1)
Impairment charges —22 —
Deferred income taxes 455 368 164
Accrued pension and other post-retirement benefi t costs (7) 72 70
Contributions to qualifi ed pension plans —(63) (141)
(Increase) decrease in
Net realized and unrealized mark-to-market and hedging transactions 13 (9) (25)
Receivables 78 (88) 2
Receivables from affi liated companies (8) 3 (4)
Inventory (65) (26) (58)
Other current assets (416) (39) (24)
Increase (decrease) in
Accounts payable 27 (18) 149
Accounts payable to affi liated companies 17 27 47
Taxes accrued 10 15 (5)
Other current liabilities (68) (86) 23
Other assets 48 (74) (28)
Other liabilities (21) (78) (6)
Net cash provided by operating activities 1,245 1,188 1,167
CASH FLOWS FROM INVESTING ACTIVITIES
Capital expenditures (1,241) (1,567) (1,525)
Purchases of available-for-sale securities (499) (901) (582)
Proceeds from sales and maturities of available-for-sale securities 458 856 532
Notes receivable from affi liated companies (237) ——
Other (12) 491
Net cash used in investing activities (1,531) (1,608) (1,484)
CASH FLOWS FROM FINANCING ACTIVITIES
Proceeds from the issuance of long-term debt 1,347 845 988
Payments for the:
Redemption of long-term debt (379) (451) (502)
Redemption of preferred stock —(62) —
Notes payable and commercial paper —— (188)
Notes payable to affi liated companies (462) 98 333
Dividends to parent (225) — (310)
Dividends paid on preferred stock —— (3)
Other (7) (7) (3)
Net cash provided by fi nancing activities 274 423 315
Net (decrease) increase in cash and cash equivalents (12) 3 (2)
Cash and Cash Equivalents at Beginning of Period 21 18 20
Cash and Cash Equivalents at End of Period $9$21 $18
Supplemental Disclosures:
Cash paid for interest, net of amount capitalized $ 220 $ 217 $ 249
Cash paid for (received from) income taxes 81 (94) 19
Signifi cant non-cash transactions:
Accrued capital expenditures 194 166 232
Asset retirement obligation additions for spent nuclear fuel disposal related to the Progress Energy merger —— 698
Capital expenditures fi nanced through capital leases —— 140
See Notes to Consolidated Financial Statements
DUKE ENERGY PROGRESS, INC.
CONSOLIDATED STATEMENTS OF CASH FLOWS