Duke Energy 2014 Annual Report Download - page 194
Download and view the complete annual report
Please find page 194 of the 2014 Duke Energy annual report below. You can navigate through the pages in the report by either clicking on the pages listed below, or by using the keyword search tool below to find specific information within the annual report.-
 1
1 -
2
-
3
-
4
-
5
-
6
-
7
-
8
-
9
-
10
-
11
-
12
-
13
-
14
-
15
-
16
-
17
-
18
-
19
-
20
-
21
-
22
-
23
-
24
-
25
-
26
-
27
-
28
-
29
-
30
-
31
-
32
-
33
-
34
-
35
-
36
-
37
-
38
-
39
-
40
-
41
-
42
-
43
-
44
-
45
-
46
-
47
-
48
-
49
-
50
-
51
-
52
-
53
-
54
-
55
-
56
-
57
-
58
-
59
-
60
-
61
-
62
-
63
-
64
-
65
-
66
-
67
-
68
-
69
-
70
-
71
-
72
-
73
-
74
-
75
-
76
-
77
-
78
-
79
-
80
-
81
-
82
-
83
-
84
-
85
-
86
-
87
-
88
-
89
-
90
-
91
-
92
-
93
-
94
-
95
-
96
-
97
-
98
-
99
-
100
-
101
-
102
-
103
-
104
-
105
-
106
-
107
-
108
-
109
-
110
-
111
-
112
-
113
-
114
-
115
-
116
-
117
-
118
-
119
-
120
-
121
-
122
-
123
-
124
-
125
-
126
-
127
-
128
-
129
-
130
-
131
-
132
-
133
-
134
-
135
-
136
-
137
-
138
-
139
-
140
-
141
-
142
-
143
-
144
-
145
-
146
-
147
-
148
-
149
-
150
-
151
-
152
-
153
-
154
-
155
-
156
-
157
-
158
-
159
-
160
-
161
-
162
-
163
-
164
-
165
-
166
-
167
-
168
-
169
-
170
-
171
-
172
-
173
-
174
-
175
-
176
-
177
-
178
-
179
-
180
-
181
-
182
-
183
-
 184
184 -
 185
185 -
 186
186 -
 187
187 -
 188
188 -
 189
189 -
 190
190 -
 191
191 -
 192
192 -
 193
193 -
 194
194 -
 195
195 -
 196
196 -
 197
197 -
 198
198 -
 199
199 -
 200
200 -
 201
201 -
 202
202 -
 203
203 -
 204
204 -
205
-
206
-
207
-
208
-
209
-
210
-
211
-
212
-
213
-
214
-
215
-
216
-
217
-
218
-
219
-
220
-
221
-
222
-
223
-
224
-
225
-
226
-
227
-
228
-
229
-
230
-
231
-
232
-
233
-
234
-
235
-
236
-
237
-
238
-
239
-
240
-
241
-
242
-
243
-
244
-
245
-
246
-
247
-
248
-
249
-
250
-
251
-
252
-
253
-
254
-
255
-
256
-
257
-
258
-
259
-
260
-
261
-
262
-
263
-
264
 |
 |

174
PART II
DUKE ENERGY CORPORATION • DUKE ENERGY CAROLINAS, LLC • PROGRESS ENERGY, INC. •
DUKE ENERGY PROGRESS, INC. • DUKE ENERGY FLORIDA, INC. • DUKE ENERGY OHIO, INC. • DUKE ENERGY INDIANA, INC.
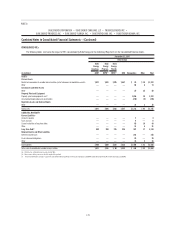
Combined Notes to Consolidated Financial Statements – (Continued)
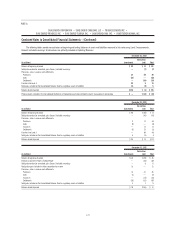
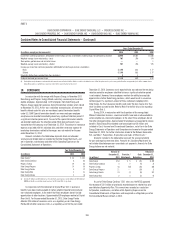
The following table provides a reconciliation of beginning and ending balances of assets and liabilities measured at fair value using Level 3 measurements.
Derivatives (net)
Years Ended December 31,
(in millions) 2014 2013 2012
Balance at beginning of period $— $(38) $(24)
Total pretax realized or unrealized gains included in earnings ——1
Purchases, sales, issuances and settlements:
Issuances —10 (16)
Settlements ——4
Transfers into Level 3 —34 —
Total losses included on the Consolidated Balance Sheet as regulatory assets or liabilities —(6) (3)
Balance at end of period $— $ — $(38)
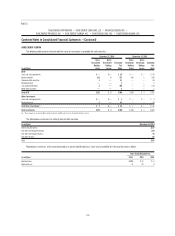
DUKE ENERGY PROGRESS
The following tables provide recorded balances for assets and liabilities measured at fair value on a recurring basis on the Consolidated Balance Sheets.
Derivative amounts in the table below exclude cash collateral which is disclosed in Note 14. See Note 15 for additional information related to investments by major
security type.
December 31, 2014
(in millions) Total Fair Value Level 1 Level 2 Level 3
Nuclear decommissioning trust fund equity securities $1,171 $1,171 $ — $ —
Nuclear decommissioning trust fund debt securities and other 540 151 389 —
Total assets 1,711 1,322 389 —
Derivative liabilities (132) — (132) —
Net assets $1,579 $1,322 $ 257 $ —
December 31, 2013
(in millions) Total Fair Value Level 1 Level 2 Level 3
Nuclear decommissioning trust fund equity securities $ 1,069 $1,069 $ — $—
Nuclear decommissioning trust fund debt securities and other 470 137 333 —
Other trading and available-for-sale debt securities and other 3 3 — —
Derivative assets 1— 1—
Total assets 1,543 1,209 334 —
Derivative liabilities (66) — (66) —
Net assets $ 1,477 $1,209 $ 268 $—