Duke Energy 2014 Annual Report Download - page 55
Download and view the complete annual report
Please find page 55 of the 2014 Duke Energy annual report below. You can navigate through the pages in the report by either clicking on the pages listed below, or by using the keyword search tool below to find specific information within the annual report.-
 1
1 -
2
-
3
-
4
-
5
-
6
-
7
-
8
-
9
-
10
-
11
-
12
-
13
-
14
-
15
-
16
-
17
-
18
-
19
-
20
-
21
-
22
-
23
-
24
-
25
-
26
-
27
-
28
-
29
-
30
-
31
-
32
-
33
-
34
-
35
-
36
-
37
-
38
-
39
-
40
-
41
-
42
-
43
-
44
-
 45
45 -
 46
46 -
 47
47 -
 48
48 -
 49
49 -
 50
50 -
 51
51 -
 52
52 -
 53
53 -
 54
54 -
 55
55 -
 56
56 -
 57
57 -
 58
58 -
 59
59 -
 60
60 -
 61
61 -
 62
62 -
 63
63 -
 64
64 -
 65
65 -
66
-
67
-
68
-
69
-
70
-
71
-
72
-
73
-
74
-
75
-
76
-
77
-
78
-
79
-
80
-
81
-
82
-
83
-
84
-
85
-
86
-
87
-
88
-
89
-
90
-
91
-
92
-
93
-
94
-
95
-
96
-
97
-
98
-
99
-
100
-
101
-
102
-
103
-
104
-
105
-
106
-
107
-
108
-
109
-
110
-
111
-
112
-
113
-
114
-
115
-
116
-
117
-
118
-
119
-
120
-
121
-
122
-
123
-
124
-
125
-
126
-
127
-
128
-
129
-
130
-
131
-
132
-
133
-
134
-
135
-
136
-
137
-
138
-
139
-
140
-
141
-
142
-
143
-
144
-
145
-
146
-
147
-
148
-
149
-
150
-
151
-
152
-
153
-
154
-
155
-
156
-
157
-
158
-
159
-
160
-
161
-
162
-
163
-
164
-
165
-
166
-
167
-
168
-
169
-
170
-
171
-
172
-
173
-
174
-
175
-
176
-
177
-
178
-
179
-
180
-
181
-
182
-
183
-
184
-
185
-
186
-
187
-
188
-
189
-
190
-
191
-
192
-
193
-
194
-
195
-
196
-
197
-
198
-
199
-
200
-
201
-
202
-
203
-
204
-
205
-
206
-
207
-
208
-
209
-
210
-
211
-
212
-
213
-
214
-
215
-
216
-
217
-
218
-
219
-
220
-
221
-
222
-
223
-
224
-
225
-
226
-
227
-
228
-
229
-
230
-
231
-
232
-
233
-
234
-
235
-
236
-
237
-
238
-
239
-
240
-
241
-
242
-
243
-
244
-
245
-
246
-
247
-
248
-
249
-
250
-
251
-
252
-
253
-
254
-
255
-
256
-
257
-
258
-
259
-
260
-
261
-
262
-
263
-
264
 |
 |

35
PART II
the stormwater pipe, stopping the release of materials into the river. Duke Energy
is a party to multiple lawsuits fi led in regards to the Dan River coal ash release
and operations at other North Carolina facilities with ash basins. The outcome
of these lawsuits could have an adverse impact to Regulated Utilities’ fi nancial
position, results of operations and cash fl ows. See Note 5 to the Consolidated
Financial Statements, “Commitments and Contingencies,” for additional
information.
An order from regulatory authorities disallowing recovery of costs related
to closure of ash basins could have an adverse impact to the Regulated Utilities’
fi nancial position, results of operations and cash fl ows. See Notes 5 and 9 to
the Consolidated Financial Statements, “Commitments and Contingencies” and
“Asset Retirement Obligations,” respectively, for additional information.
In 2015, the Indiana Utility Regulatory Commission (IURC) is examining
intervenors’ allegations that the Edwardsport IGCC was not properly placed in
commercial operation in June 2013 and intervenors’ allegations regarding plant
performance. In addition, the Indiana Court of Appeals remanded the IURC
order in the ninth IGCC rider proceeding back to the IURC for further fi ndings
concerning approximately $61 million of fi nancing charges Joint Intervenors
claimed were caused by construction delay and a ratemaking issue concerning
the in-service date determination for tax purposes. The outcome of these
proceedings could have an adverse impact to Regulated Utilities’ fi nancial
position, results of operations and cash fl ows. Duke Energy cannot predict on
the outcome of these proceedings. See Note 4 to the Consolidated Financial
Statements, “Regulatory Matters,” for additional information.
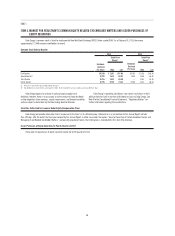
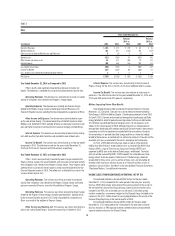
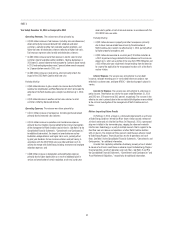
International Energy
Years Ended December 31,
(in millions) 2014 2013
Variance
2014 vs.
2013 2012
Variance
2013 vs.
2012
Operating Revenues $ 1,417 $ 1,546 $ (129) $ 1,549 $ (3)
Operating Expenses 1,007 1,000 7 1,043 (43)
Gains (Losses) on Sales of Other Assets and Other, net 633— 3
Operating Income 416 549 (133) 506 43
Other Income and Expense, net 190 125 65 171 (46)
Interest Expense 93 86 7 76 10
Income Before Income Taxes 513 588 (75) 601 (13)
Income Tax Expense 449 166 283 149 17
Less: Income Attributable to Noncontrolling Interests 914 (5) 13 1
Segment Income $55 $ 408 $ (353) $ 439 $ (31)
Sales, GWh 18,629 20,306 (1,677) 20,132 174
Net proportional MW capacity in operation 4,340 4,600 (260) 4,584 16
Year Ended December 31, 2014 as Compared to 2013
International Energy’s results were negatively impacted by higher tax
expense resulting from the decision to repatriate historical undistributed foreign
earnings, unfavorable hydrology and exchange rates in Brazil and an unplanned
outage in Chile, partially offset by higher equity earnings in National Methanol
Company (NMC) and a 2013 net currency remeasurement loss in Latin America.
The following is a detailed discussion of the variance drivers by line item.
Operating Revenues. The variance was driven primarily by:
• A $44 million decrease in Peru as a result of lower sales volumes and
unfavorable exchange rates;
• A $35 million decrease in Brazil due to unfavorable exchange rates and
lower sales volumes partially offset by higher average prices;
• A $27 million decrease in Chile as a result of lower sales volumes due to
an unplanned outage, and lower average prices; and
• A $25 million decrease in Argentina due to unfavorable exchange rates
and lower average prices.
Operating Expenses. The variance was driven primarily by:
• A $75 million increase in Brazil due to higher purchased power as a
result of unfavorable hydrology, partially offset by favorable exchange
rates.
Partially offset by:
• A $38 million decrease in Peru as a result of lower purchased power,
transmission, and royalty costs; and
• A $26 million decrease in Argentina due to favorable exchange rates and
lower purchased power and fuel consumption.
Other Income and Expenses, net. The variance is primarily due to a
2013 net currency remeasurement loss in Latin America, higher interest income
in Brazil, and higher equity earnings in NMC as a result of increased methyl
tertiary butyl ether (MTBE) and methanol sales volumes, partially offset by lower
average prices and higher butane costs.
Income Tax Expense. The variance was primarily due to approximately
$373 million of incremental tax expense resulting from the decision to repatriate
all cumulative historical undistributed foreign earnings at that time. The effective
tax rate for the years ended December 31, 2014 and 2013 was 87.3 percent
and 28.3 percent, respectively. The increase in the effective tax rate was also
primarily due to the tax expense associated with the repatriation decision.
Year Ended December 31, 2013 as Compared to 2012
International Energy’s results were negatively impacted by an extended
outage at NMC and unfavorable exchange rates in Latin America, partially offset
by the acquisition of Iberoamericana de Energía Ibener, S.A. (Ibener) in 2012 and
higher average prices and lower purchased power costs in Brazil. The following is
a detailed discussion of the variance drivers by line item.