Duke Energy 2014 Annual Report Download - page 27
Download and view the complete annual report
Please find page 27 of the 2014 Duke Energy annual report below. You can navigate through the pages in the report by either clicking on the pages listed below, or by using the keyword search tool below to find specific information within the annual report.-
 1
1 -
2
-
3
-
4
-
5
-
6
-
7
-
8
-
9
-
10
-
11
-
12
-
13
-
14
-
15
-
16
-
 17
17 -
 18
18 -
 19
19 -
 20
20 -
 21
21 -
 22
22 -
 23
23 -
 24
24 -
 25
25 -
 26
26 -
 27
27 -
 28
28 -
 29
29 -
 30
30 -
 31
31 -
 32
32 -
 33
33 -
 34
34 -
 35
35 -
 36
36 -
 37
37 -
38
-
39
-
40
-
41
-
42
-
43
-
44
-
45
-
46
-
47
-
48
-
49
-
50
-
51
-
52
-
53
-
54
-
55
-
56
-
57
-
58
-
59
-
60
-
61
-
62
-
63
-
64
-
65
-
66
-
67
-
68
-
69
-
70
-
71
-
72
-
73
-
74
-
75
-
76
-
77
-
78
-
79
-
80
-
81
-
82
-
83
-
84
-
85
-
86
-
87
-
88
-
89
-
90
-
91
-
92
-
93
-
94
-
95
-
96
-
97
-
98
-
99
-
100
-
101
-
102
-
103
-
104
-
105
-
106
-
107
-
108
-
109
-
110
-
111
-
112
-
113
-
114
-
115
-
116
-
117
-
118
-
119
-
120
-
121
-
122
-
123
-
124
-
125
-
126
-
127
-
128
-
129
-
130
-
131
-
132
-
133
-
134
-
135
-
136
-
137
-
138
-
139
-
140
-
141
-
142
-
143
-
144
-
145
-
146
-
147
-
148
-
149
-
150
-
151
-
152
-
153
-
154
-
155
-
156
-
157
-
158
-
159
-
160
-
161
-
162
-
163
-
164
-
165
-
166
-
167
-
168
-
169
-
170
-
171
-
172
-
173
-
174
-
175
-
176
-
177
-
178
-
179
-
180
-
181
-
182
-
183
-
184
-
185
-
186
-
187
-
188
-
189
-
190
-
191
-
192
-
193
-
194
-
195
-
196
-
197
-
198
-
199
-
200
-
201
-
202
-
203
-
204
-
205
-
206
-
207
-
208
-
209
-
210
-
211
-
212
-
213
-
214
-
215
-
216
-
217
-
218
-
219
-
220
-
221
-
222
-
223
-
224
-
225
-
226
-
227
-
228
-
229
-
230
-
231
-
232
-
233
-
234
-
235
-
236
-
237
-
238
-
239
-
240
-
241
-
242
-
243
-
244
-
245
-
246
-
247
-
248
-
249
-
250
-
251
-
252
-
253
-
254
-
255
-
256
-
257
-
258
-
259
-
260
-
261
-
262
-
263
-
264
 |
 |

PART I
7
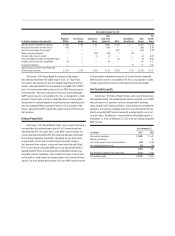
The number of residential, general service and industrial customers
within the Regulated Utilities service territory is expected to increase over time.
However, growth in the near term has been hampered by current economic
conditions. Average usage per residential customer is expected to remain fl at or
decline for the foreseeable future. While total industrial and general service sales
increased in 2014 when compared to 2013, the growth rate was modest when
compared to historical periods.
Seasonality and the Impact of Weather
Regulated Utilities’ costs and revenues are infl uenced by seasonal
patterns. Peak sales of electricity occur during the summer and winter months,
resulting in higher revenue and cash fl ows in these periods. By contrast, lower
sales of electricity occur during the spring and fall, allowing for scheduled plant
maintenance. Peak gas sales occur during the winter months. Residential and
general service customers are most impacted by weather. Estimated weather
impacts are based on actual current period weather compared to normal weather
conditions. Normal weather conditions are defi ned as the long-term average of
actual historical weather conditions.
The estimated impact of weather on earnings is based on the number
of customers, temperature variances from a normal condition and customers’
historic usage levels and patterns. The methodology used to estimate the impact
of weather does not and cannot consider all variables that may impact customer
response to weather conditions such as humidity and relative temperature
changes. The precision of this estimate may also be impacted by applying long-
term weather trends to shorter-term periods.
Degree-day data are used to estimate energy required to maintain
comfortable indoor temperatures based on each day’s average temperature.
Heating-degree days measure the variation in weather based on the extent
the average daily temperature falls below a base temperature. Cooling-degree
days measure the variation in weather based on the extent the average daily
temperature rises above the base temperature. Each degree of temperature
below the base temperature counts as one heating-degree day and each degree
of temperature above the base temperature counts as one cooling-degree day.
Competition
Retail
Regulated Utilities’ businesses operate as the sole supplier of electricity
within their service territories, with the exception of Ohio, which has a
competitive electricity supply market for generation service. Regulated Utilities
owns and operates facilities necessary to transmit and distribute electricity and,
except in Ohio, to generate electricity. Services are priced by state commission
approved rates designed to include the costs of providing these services and
a reasonable return on invested capital. This regulatory policy is intended to
provide safe and reliable electricity at fair prices. Competition in the regulated
electric distribution business is primarily from on-site generation of industrial
customers and distributed generation, such as rooftop solar, at residential,
general service and/or industrial customer sites.
Regulated Utilities is not aware of any proposed legislation in any
jurisdiction that would give its retail customers the right to choose their
electricity provider or otherwise restructure or deregulate the electric industry.
Although there is no pending legislation at this time, if the retail
jurisdictions served by Regulated Utilities become subject to deregulation, the
recovery of stranded costs could become a signifi cant consideration. Stranded
costs primarily include the generation assets of Regulated Utilities whose value
in a competitive marketplace may be less than their current book value, as well
as above-market purchased power commitments from qualifying facilities (QFs).
The Public Utility Regulatory Policies Act of 1978 (PURPA) established a new
class of generating facilities as QFs, typically small power production facilities
that generate power within a utility company’s service territory for which the
utility companies are legally obligated to purchase the energy at an avoided cost
rate. Thus far, all states that have passed restructuring legislation have provided
for the opportunity to recover a substantial portion of stranded costs.
Regulated Utilities’ largest stranded cost exposure is primarily related to
Duke Energy Florida’s purchased power commitments with QFs, under which it
has future minimum expected capacity payments through 2025 of $2.2 billion.
Duke Energy Florida was obligated to enter into these contracts under provisions
of PURPA. Duke Energy Florida continues to seek ways to address the impact
of escalating payments under these contracts. However, the FPSC allows
full recovery of the retail portion of the cost of power purchased from QFs.
For additional information related to these purchased power commitments,
see Note 5 to the Consolidated Financial Statements, “Commitments and
Contingencies.”
In Ohio, Regulated Utilities conducts competitive auctions for electricity
supply. The cost of energy purchased through these auctions is recovered
from retail customers. Regulated Utilities earns retail margin in Ohio on the
transmission and distribution of electricity only and not on the cost of the
underlying energy.
Wholesale
Regulated Utilities competes with other utilities and merchant generators
for bulk power sales, sales to municipalities and cooperatives, and wholesale
transactions. The principal factors in competing for these sales are price,
availability of capacity and power, and reliability of service. Prices are infl uenced
primarily by market conditions and fuel costs.
Increased competition in the wholesale electric utility industry and
the availability of transmission access could affect Regulated Utilities’ load
forecasts, plans for power supply and wholesale energy sales and related
revenues. Wholesale energy sales will be impacted by the extent to which
additional generation is available to sell to the wholesale market and the ability
of Regulated Utilities to attract new customers and to retain existing customers.
Energy Capacity and Resources
Regulated Utilities owns approximately 50,000 megawatts (MW) of
generation capacity. For additional information on Regulated Utilities’ generation
facilities, see Item 2, “Properties.”
Energy and capacity are also supplied through contracts with other
generators and purchased on the open market. Factors that could cause
Regulated Utilities to purchase power for its customers include generating plant
outages, extreme weather conditions, generation reliability, growth and price.
Regulated Utilities has interconnections and arrangements with its neighboring
utilities to facilitate planning, emergency assistance, sale and purchase of
capacity and energy, and reliability of power supply.
Regulated Utilities’ generation portfolio is a balanced mix of energy
resources having different operating characteristics and fuel sources designed
to provide energy at the lowest possible cost to meet its obligation to serve retail
customers. All options, including owned generation resources and purchased
power opportunities, are continually evaluated on a real-time basis to select and
dispatch the lowest-cost resources available to meet system load requirements.