Duke Energy 2014 Annual Report Download - page 52
Download and view the complete annual report
Please find page 52 of the 2014 Duke Energy annual report below. You can navigate through the pages in the report by either clicking on the pages listed below, or by using the keyword search tool below to find specific information within the annual report.-
 1
1 -
2
-
3
-
4
-
5
-
6
-
7
-
8
-
9
-
10
-
11
-
12
-
13
-
14
-
15
-
16
-
17
-
18
-
19
-
20
-
21
-
22
-
23
-
24
-
25
-
26
-
27
-
28
-
29
-
30
-
31
-
32
-
33
-
34
-
35
-
36
-
37
-
38
-
39
-
40
-
41
-
 42
42 -
 43
43 -
 44
44 -
 45
45 -
 46
46 -
 47
47 -
 48
48 -
 49
49 -
 50
50 -
 51
51 -
 52
52 -
 53
53 -
 54
54 -
 55
55 -
 56
56 -
 57
57 -
 58
58 -
 59
59 -
 60
60 -
 61
61 -
 62
62 -
63
-
64
-
65
-
66
-
67
-
68
-
69
-
70
-
71
-
72
-
73
-
74
-
75
-
76
-
77
-
78
-
79
-
80
-
81
-
82
-
83
-
84
-
85
-
86
-
87
-
88
-
89
-
90
-
91
-
92
-
93
-
94
-
95
-
96
-
97
-
98
-
99
-
100
-
101
-
102
-
103
-
104
-
105
-
106
-
107
-
108
-
109
-
110
-
111
-
112
-
113
-
114
-
115
-
116
-
117
-
118
-
119
-
120
-
121
-
122
-
123
-
124
-
125
-
126
-
127
-
128
-
129
-
130
-
131
-
132
-
133
-
134
-
135
-
136
-
137
-
138
-
139
-
140
-
141
-
142
-
143
-
144
-
145
-
146
-
147
-
148
-
149
-
150
-
151
-
152
-
153
-
154
-
155
-
156
-
157
-
158
-
159
-
160
-
161
-
162
-
163
-
164
-
165
-
166
-
167
-
168
-
169
-
170
-
171
-
172
-
173
-
174
-
175
-
176
-
177
-
178
-
179
-
180
-
181
-
182
-
183
-
184
-
185
-
186
-
187
-
188
-
189
-
190
-
191
-
192
-
193
-
194
-
195
-
196
-
197
-
198
-
199
-
200
-
201
-
202
-
203
-
204
-
205
-
206
-
207
-
208
-
209
-
210
-
211
-
212
-
213
-
214
-
215
-
216
-
217
-
218
-
219
-
220
-
221
-
222
-
223
-
224
-
225
-
226
-
227
-
228
-
229
-
230
-
231
-
232
-
233
-
234
-
235
-
236
-
237
-
238
-
239
-
240
-
241
-
242
-
243
-
244
-
245
-
246
-
247
-
248
-
249
-
250
-
251
-
252
-
253
-
254
-
255
-
256
-
257
-
258
-
259
-
260
-
261
-
262
-
263
-
264
 |
 |

32
PART II
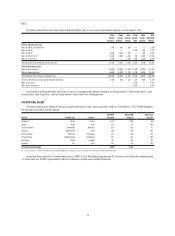
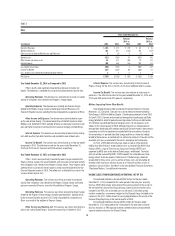
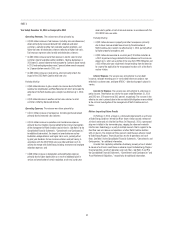
Year Ended December 31, 2012
(in millions, except per share amounts)
Regulated
Utilities
International
Energy
Commercial
Power
Total
Reportable
Segments Other
Eliminations/
Discontinued
Operations
Duke
Energy
Per
Diluted
Share
Adjusted segment income/Adjusted earnings $2,086 $ 439 $ 93 $2,618 $ (129) $ — $2,489 $ 4.33
Edwardsport impairment and other charges (402) — — (402) — — (402) (0.70)
Costs to achieve Progress Energy merger — — — — (397) — (397) (0.70)
Midwest generation operations — — (149) (149) 9 140 — —
Economic hedges (mark-to-market) — — (3) (3) — — (3) (0.01)
Democratic National Convention
Host Committee support — — — — (6) — (6) (0.01)
Employee severance and offi ce consolidation 60
—— 60 — — 60 0.11
Discontinued operations — — — — — 27 27 0.05
Segment income (loss)/Net Income
Attributable to Duke Energy Corporation $1,744 $ 439 $ (59) $2,124 $ (523) $ 167 $1,768 $ 3.07
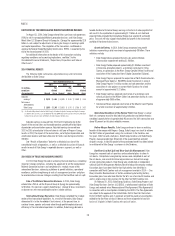
The variance in adjusted earnings for the year ended December 31, 2014,
compared to 2013, was primarily due to:
• Increased retail pricing and riders primarily resulting from the
implementation of revised rates in most jurisdictions;
• Favorable weather in 2014 compared to 2013;
• Higher PJM capacity revenues for the nonregulated Midwest generation
business due to higher prices; and
• Higher results of the renewables business due to higher production from
the wind and solar portfolios, lower costs and additional renewables
investments.
Partially offset by:
• Higher depreciation and amortization expense primarily due to higher
depreciable asset base and lower reductions to cost of removal
reserves;
• Higher operations and maintenance expense due to higher storm costs,
the timing of fossil plant outages and the impact of nuclear outage cost
levelization;
• Lower post in-service debt returns due to projects added to customer
rates; and
• Higher property and other non-income taxes.
The variance in adjusted earnings for the year ended December 31, 2013,
compared to 2012, was primarily due to:
• The inclusion of Progress Energy results for the fi rst six months of 2013;
• Increased retail pricing and riders resulting primarily from the
implementation of revised rates in all jurisdictions; and
• Lower operating and maintenance expense resulting primarily from
the adoption of nuclear outage cost levelization in the Carolinas, lower
benefi t costs and merger synergies.
Partially offsetting these increases was:
• Higher depreciation and amortization expense;
• Lower AFUDC;
• Lower nonregulated Midwest gas generation results; and
• Incremental shares issued to complete the Progress Energy merger
(impacts per diluted share amounts only).
SEGMENT RESULTS
The remaining information presented in this discussion of results of
operations is on a GAAP basis.