Duke Energy 2014 Annual Report Download - page 124
Download and view the complete annual report
Please find page 124 of the 2014 Duke Energy annual report below. You can navigate through the pages in the report by either clicking on the pages listed below, or by using the keyword search tool below to find specific information within the annual report.-
 1
1 -
2
-
3
-
4
-
5
-
6
-
7
-
8
-
9
-
10
-
11
-
12
-
13
-
14
-
15
-
16
-
17
-
18
-
19
-
20
-
21
-
22
-
23
-
24
-
25
-
26
-
27
-
28
-
29
-
30
-
31
-
32
-
33
-
34
-
35
-
36
-
37
-
38
-
39
-
40
-
41
-
42
-
43
-
44
-
45
-
46
-
47
-
48
-
49
-
50
-
51
-
52
-
53
-
54
-
55
-
56
-
57
-
58
-
59
-
60
-
61
-
62
-
63
-
64
-
65
-
66
-
67
-
68
-
69
-
70
-
71
-
72
-
73
-
74
-
75
-
76
-
77
-
78
-
79
-
80
-
81
-
82
-
83
-
84
-
85
-
86
-
87
-
88
-
89
-
90
-
91
-
92
-
93
-
94
-
95
-
96
-
97
-
98
-
99
-
100
-
101
-
102
-
103
-
104
-
105
-
106
-
107
-
108
-
109
-
110
-
111
-
112
-
113
-
 114
114 -
 115
115 -
 116
116 -
 117
117 -
 118
118 -
 119
119 -
 120
120 -
 121
121 -
 122
122 -
 123
123 -
 124
124 -
 125
125 -
 126
126 -
 127
127 -
 128
128 -
 129
129 -
 130
130 -
 131
131 -
 132
132 -
 133
133 -
 134
134 -
135
-
136
-
137
-
138
-
139
-
140
-
141
-
142
-
143
-
144
-
145
-
146
-
147
-
148
-
149
-
150
-
151
-
152
-
153
-
154
-
155
-
156
-
157
-
158
-
159
-
160
-
161
-
162
-
163
-
164
-
165
-
166
-
167
-
168
-
169
-
170
-
171
-
172
-
173
-
174
-
175
-
176
-
177
-
178
-
179
-
180
-
181
-
182
-
183
-
184
-
185
-
186
-
187
-
188
-
189
-
190
-
191
-
192
-
193
-
194
-
195
-
196
-
197
-
198
-
199
-
200
-
201
-
202
-
203
-
204
-
205
-
206
-
207
-
208
-
209
-
210
-
211
-
212
-
213
-
214
-
215
-
216
-
217
-
218
-
219
-
220
-
221
-
222
-
223
-
224
-
225
-
226
-
227
-
228
-
229
-
230
-
231
-
232
-
233
-
234
-
235
-
236
-
237
-
238
-
239
-
240
-
241
-
242
-
243
-
244
-
245
-
246
-
247
-
248
-
249
-
250
-
251
-
252
-
253
-
254
-
255
-
256
-
257
-
258
-
259
-
260
-
261
-
262
-
263
-
264
 |
 |

104
PART II
DUKE ENERGY CORPORATION • DUKE ENERGY CAROLINAS, LLC • PROGRESS ENERGY, INC. •
DUKE ENERGY PROGRESS, INC. • DUKE ENERGY FLORIDA, INC. • DUKE ENERGY OHIO, INC. • DUKE ENERGY INDIANA, INC.
Combined Notes to Consolidated Financial Statements – (Continued)
Duke Energy Indiana is a regulated public utility primarily engaged in
the generation, transmission, distribution and sale of electricity in portions
of Indiana. Duke Energy Indiana is subject to the regulatory provisions of the
Indiana Utility Regulatory Commission (IURC) and FERC. Substantially all of
Duke Energy Indiana’s operations qualify for regulatory accounting.
Certain prior year amounts have been reclassifi ed to conform to the
current year presentation.
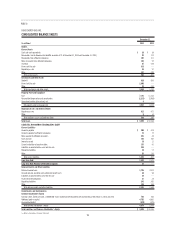
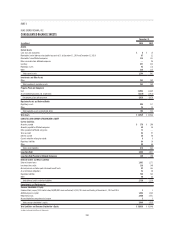
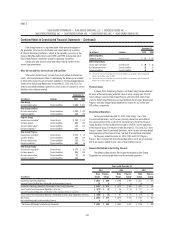
Other Current and Non-Current Assets and Liabilities
Other within Current Assets includes the current portion of deferred tax
assets, which are disclosed in Note 22. Additionally, the following are included
in Other within Current Assets or Current Liabilities in the Consolidated Balance
Sheets of the Duke Energy Registrants at December 31, 2014 and 2013. The
amounts presented exceeded 5 percent of current assets or 5 percent of current
liabilities unless otherwise noted.
December 31,
(in millions) Location 2014 2013
Duke Energy
Accrued compensation Current Liabilities $ 638 $ 621
Duke Energy Carolinas
Accrued compensation Current Liabilities $ 216 $ 198
Collateral liabilities Current Liabilities 128 120
Progress Energy
Income taxes receivable(b) Current Assets $ 718 $ 119
Customer deposits Current Liabilities 360 349
Accrued compensation(a) Current Liabilities 174 214
Derivative liabilities(b) Current Liabilities 271 ––
Duke Energy Progress
Income taxes receivable(b) Current Assets $ 272 $ 15
Customer deposits Current Liabilities 135 129
Accrued compensation Current Liabilities 116 121
Derivative liabilities(b) Current Liabilities 108 38
Duke Energy Florida
Income taxes receivable(b) Current Assets $ 177 $65
Customer deposits Current Liabilities 225 220
Accrued compensation(a) Current Liabilities 57 65
Derivative liabilities(b) Current Liabilities 163 ––
December 31,
(in millions) Location 2014 2013
Duke Energy Ohio
Collateral assets(a) Current Assets $13 $ 122
Duke Energy Indiana
Income taxes receivable Current Assets $98 $56
Accrued compensation(a) Current Liabilities 25 25
Collateral liabilities Current Liabilities 43 40
(a) Does not exceed 5 percent of total current assets or liabilities, as appropriate, on the Consolidated
Balance Sheets at December 31, 2014.
(b) Does not exceed 5 percent of total current assets or liabilities, as appropriate, on the Consolidated
Balance Sheets at December 31, 2013.
Preferred Stock
In March 2013, Duke Energy Progress and Duke Energy Florida redeemed
all series of their outstanding preferred stock at prices ranging from $101.00
to $110.00 per share for Duke Energy Progress and $101.00 to $104.25 per
share for Duke Energy Florida plus accrued dividends for all series. Duke Energy
Progress and Duke Energy Florida redeemed the shares for $62 million and
$34 million, respectively.
Discontinued Operations
For the year ended December 31, 2014, Duke Energy’s Loss from
Discontinued Operations, net of tax was primarily related to a write-down of
the carrying amount of the assets to the estimated fair value of the Disposal
Group, based on the transaction price included in the PSA, and the operations
of the Disposal Group. For the years ended December 31, 2013 and 2012, Duke
Energy’s Income From Discontinued Operations, net of tax was primarily related
to the operations of the Disposal Group. See Note 2 for additional information.
For the years ended December 31, 2014, 2013 and 2012. Progress
Energy’s (Loss) Income From Discontinued Operations, net of tax was primarily
due to tax impacts related to prior sales of diversifi ed businesses.
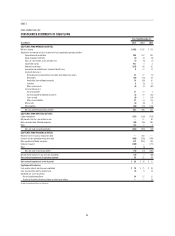
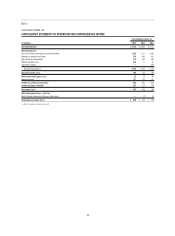
Amounts Attributable to Controlling Interests
The following table presents Net Income Attributable to Duke Energy
Corporation for continuing operations and discontinued operations.
Years ended December 31,
2014 2013 2012
(in millions)
Duke
Energy
Progress
Energy
Duke
Energy
Progress
Energy
Duke
Energy
Progress
Energy
Income from Continuing Operations $ 2,465 $ 880 $ 2,590 $ 659 $ 1,611 $ 355
Income of Continuing Operations Attributable to Noncontrolling Interests 14 5 16 3 18 7
Income from Continuing Operations Attributable to Duke Energy Corporation $ 2,451 $ 875 $ 2,574 $ 656 $ 1,593 $ 348
(Loss) Income From Discontinued Operations, net of tax $ (576) $ (6) $ 86 $ 16 $ 171 $ 52
Loss of Discontinued Operations attributable to Noncontrolling Interests, net of tax (8) — (5) — (4) —
(Loss) Income From Discontinued Operations Attributable to Duke Energy Corporation, net of tax $ (568) $ (6) $ 91 $ 16 $ 175 $ 52
Net Income $ 1,889 $ 874 $ 2,676 $ 675 $ 1,782 $ 407
Net Income Attributable to Noncontrolling Interest 65 11 3 14 7
Net Income Attributable to Duke Energy Corporation $ 1,883 $ 869 $ 2,665 $ 672 $ 1,768 $ 400