Duke Energy 2014 Annual Report Download - page 209
Download and view the complete annual report
Please find page 209 of the 2014 Duke Energy annual report below. You can navigate through the pages in the report by either clicking on the pages listed below, or by using the keyword search tool below to find specific information within the annual report.-
 1
1 -
2
-
3
-
4
-
5
-
6
-
7
-
8
-
9
-
10
-
11
-
12
-
13
-
14
-
15
-
16
-
17
-
18
-
19
-
20
-
21
-
22
-
23
-
24
-
25
-
26
-
27
-
28
-
29
-
30
-
31
-
32
-
33
-
34
-
35
-
36
-
37
-
38
-
39
-
40
-
41
-
42
-
43
-
44
-
45
-
46
-
47
-
48
-
49
-
50
-
51
-
52
-
53
-
54
-
55
-
56
-
57
-
58
-
59
-
60
-
61
-
62
-
63
-
64
-
65
-
66
-
67
-
68
-
69
-
70
-
71
-
72
-
73
-
74
-
75
-
76
-
77
-
78
-
79
-
80
-
81
-
82
-
83
-
84
-
85
-
86
-
87
-
88
-
89
-
90
-
91
-
92
-
93
-
94
-
95
-
96
-
97
-
98
-
99
-
100
-
101
-
102
-
103
-
104
-
105
-
106
-
107
-
108
-
109
-
110
-
111
-
112
-
113
-
114
-
115
-
116
-
117
-
118
-
119
-
120
-
121
-
122
-
123
-
124
-
125
-
126
-
127
-
128
-
129
-
130
-
131
-
132
-
133
-
134
-
135
-
136
-
137
-
138
-
139
-
140
-
141
-
142
-
143
-
144
-
145
-
146
-
147
-
148
-
149
-
150
-
151
-
152
-
153
-
154
-
155
-
156
-
157
-
158
-
159
-
160
-
161
-
162
-
163
-
164
-
165
-
166
-
167
-
168
-
169
-
170
-
171
-
172
-
173
-
174
-
175
-
176
-
177
-
178
-
179
-
180
-
181
-
182
-
183
-
184
-
185
-
186
-
187
-
188
-
189
-
190
-
191
-
192
-
193
-
194
-
195
-
196
-
197
-
198
-
 199
199 -
 200
200 -
 201
201 -
 202
202 -
 203
203 -
 204
204 -
 205
205 -
 206
206 -
 207
207 -
 208
208 -
 209
209 -
 210
210 -
 211
211 -
 212
212 -
 213
213 -
 214
214 -
 215
215 -
 216
216 -
 217
217 -
 218
218 -
 219
219 -
220
-
221
-
222
-
223
-
224
-
225
-
226
-
227
-
228
-
229
-
230
-
231
-
232
-
233
-
234
-
235
-
236
-
237
-
238
-
239
-
240
-
241
-
242
-
243
-
244
-
245
-
246
-
247
-
248
-
249
-
250
-
251
-
252
-
253
-
254
-
255
-
256
-
257
-
258
-
259
-
260
-
261
-
262
-
263
-
264
 |
 |

189
PART II
DUKE ENERGY CORPORATION • DUKE ENERGY CAROLINAS, LLC • PROGRESS ENERGY, INC. •
DUKE ENERGY PROGRESS, INC. • DUKE ENERGY FLORIDA, INC. • DUKE ENERGY OHIO, INC. • DUKE ENERGY INDIANA, INC.
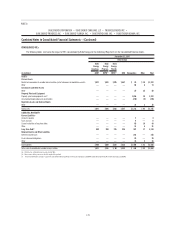
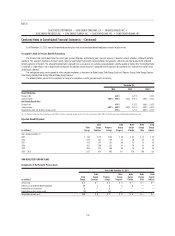
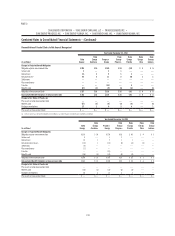
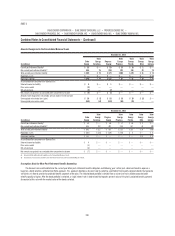
Combined Notes to Consolidated Financial Statements – (Continued)
Reconciliation of Funded Status to Net Amount Recognized
Year Ended December 31, 2014
(in millions)
Duke
Energy
Duke
Energy
Carolinas
Progress
Energy
Duke
Energy
Progress
Duke
Energy
Florida
Duke
Energy
Ohio
Duke
Energy
Indiana
Change in Projected Benefi t Obligation
Obligation at prior measurement date $ 7,510 $1,875 $2,739 $1,172 $1,233 $ 442 $ 632
Service cost 135 41 40 21 20 4 9
Interest cost 344 85 112 54 57 20 29
Actuarial loss(a) 618 132 211 98 105 41 41
Transfers — 37 (375) (61) (9) (6) —
Plan amendments (4) (1) — — — (1) —
Benefi ts paid (496) (116) (170) (97) (71) (31) (38)
Obligation at measurement date $ 8,107 $2,053 $2,557 $1,187 $1,335 $ 469 $ 673
Accumulated Benefi t Obligation at measurement date $ 7,966 $2,052 $ 2,519 $1,187 $1,297 $ 459 $ 645
Change in Fair Value of Plan Assets
Plan assets at prior measurement date $ 8,142 $2,162 $2,944 $1,330 $1,299 $ 448 $ 654
Actual return on plan assets 852 217 300 149 144 45 65
Benefi ts paid (496) (116) (170) (97) (71) (31) (38)
Transfers — 37 (352) (61) (9) (6) —
Plan assets at measurement date $ 8,498 $2,300 $2,722 $1,321 $1,363 $ 456 $ 681
Funded status of plan $ 391 $ 247 $ 165 $ 134 $ 28 $ (13) $ 8
(a) Includes an increase in benefi t obligation of $180 million as a result of changes in Duke Energy’s mortality assumptions.
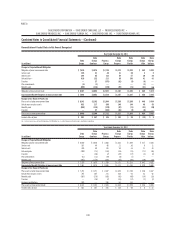
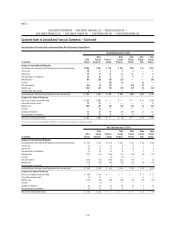
Year Ended December 31, 2013
(in millions)
Duke
Energy
Duke
Energy
Carolinas
Progress
Energy
Duke
Energy
Progress
Duke
Energy
Florida
Duke
Energy
Ohio
Duke
Energy
Indiana
Change in Projected Benefi t Obligation
Obligation at prior measurement date $ 8,030 $ 2,028 $ 2,868 $1,264 $ 1,309 $ 527 $ 684
Service cost 167 49 60 22 30 6 11
Interest cost 320 80 116 50 53 21 28
Actuarial gains (399) (73) (118) (26) (75) (71) (56)
Transfers — (26) (7) (45) (17) (2) (2)
Plan amendments (41) (13) (19) (8) (7) — —
Benefi ts paid (567) (170) (161) (85) (60) (39) (33)
Obligation at measurement date $7,510 $1,875 $2,739 $1,172 $1,233 $442 $632
Accumulated Benefi t Obligation at measurement date $ 7,361 $ 1,875 $ 2,698 $1,172 $ 1,192 $ 429 $ 608
Change in Fair Value of Plan Assets
Plan assets at prior measurement date $ 7,754 $ 2,151 $ 2,647 $1,289 $ 1,150 $ 446 $ 627
Actual return on plan assets 705 207 215 108 93 43 62
Benefi ts paid (567) (170) (161) (85) (60) (39) (33)
Transfers — (26) (7) (45) (17) (2) (2)
Employer contributions 250 — 250 63 133 — —
Plan assets at measurement date $ 8,142 $ 2,162 $ 2,944 $1,330 $ 1,299 $ 448 $ 654
Funded status of plan $ 632 $ 287 $ 205 $ 158 $ 66 $ 6 $ 22