Duke Energy 2014 Annual Report Download - page 58
Download and view the complete annual report
Please find page 58 of the 2014 Duke Energy annual report below. You can navigate through the pages in the report by either clicking on the pages listed below, or by using the keyword search tool below to find specific information within the annual report.-
 1
1 -
2
-
3
-
4
-
5
-
6
-
7
-
8
-
9
-
10
-
11
-
12
-
13
-
14
-
15
-
16
-
17
-
18
-
19
-
20
-
21
-
22
-
23
-
24
-
25
-
26
-
27
-
28
-
29
-
30
-
31
-
32
-
33
-
34
-
35
-
36
-
37
-
38
-
39
-
40
-
41
-
42
-
43
-
44
-
45
-
46
-
47
-
 48
48 -
 49
49 -
 50
50 -
 51
51 -
 52
52 -
 53
53 -
 54
54 -
 55
55 -
 56
56 -
 57
57 -
 58
58 -
 59
59 -
 60
60 -
 61
61 -
 62
62 -
 63
63 -
 64
64 -
 65
65 -
 66
66 -
 67
67 -
 68
68 -
69
-
70
-
71
-
72
-
73
-
74
-
75
-
76
-
77
-
78
-
79
-
80
-
81
-
82
-
83
-
84
-
85
-
86
-
87
-
88
-
89
-
90
-
91
-
92
-
93
-
94
-
95
-
96
-
97
-
98
-
99
-
100
-
101
-
102
-
103
-
104
-
105
-
106
-
107
-
108
-
109
-
110
-
111
-
112
-
113
-
114
-
115
-
116
-
117
-
118
-
119
-
120
-
121
-
122
-
123
-
124
-
125
-
126
-
127
-
128
-
129
-
130
-
131
-
132
-
133
-
134
-
135
-
136
-
137
-
138
-
139
-
140
-
141
-
142
-
143
-
144
-
145
-
146
-
147
-
148
-
149
-
150
-
151
-
152
-
153
-
154
-
155
-
156
-
157
-
158
-
159
-
160
-
161
-
162
-
163
-
164
-
165
-
166
-
167
-
168
-
169
-
170
-
171
-
172
-
173
-
174
-
175
-
176
-
177
-
178
-
179
-
180
-
181
-
182
-
183
-
184
-
185
-
186
-
187
-
188
-
189
-
190
-
191
-
192
-
193
-
194
-
195
-
196
-
197
-
198
-
199
-
200
-
201
-
202
-
203
-
204
-
205
-
206
-
207
-
208
-
209
-
210
-
211
-
212
-
213
-
214
-
215
-
216
-
217
-
218
-
219
-
220
-
221
-
222
-
223
-
224
-
225
-
226
-
227
-
228
-
229
-
230
-
231
-
232
-
233
-
234
-
235
-
236
-
237
-
238
-
239
-
240
-
241
-
242
-
243
-
244
-
245
-
246
-
247
-
248
-
249
-
250
-
251
-
252
-
253
-
254
-
255
-
256
-
257
-
258
-
259
-
260
-
261
-
262
-
263
-
264
 |
 |

38
PART II
Other
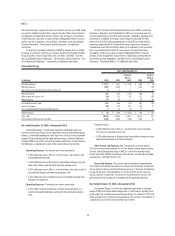
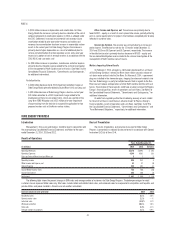
Years Ended December 31,
(in millions) 2014 2013
Variance
2014 vs.
2013 2012
Variance
2013 vs.
2012
Operating Revenues $ 105 $ 175 $ (70) $ 84 $ 91
Operating Expenses 322 457 (135) 704 (247)
Gains (Losses) on Sales of Other Assets and Other, net 6(3) 9(7)4
Operating Loss (211) (285) 74 (627) 342
Other Income and Expense, net 45 131 (86) 19 112
Interest Expense 400 416 (16) 299 117
Loss Before Income Taxes (566) (570) 4 (907) 337
Income Tax Benefi t (237) (335) 98 (386) 51
Less: Income (Loss) Attributable to Noncontrolling Interests 53221
Net Expense $ (334) $ (238) $ (96) $ (523) $ 285
Year Ended December 31, 2014 as Compared to 2013
Other’s results were negatively impacted by a decrease in income tax
benefi t. The following is a detailed discussion of the variance drivers by line item.
Operating Revenues. The decrease was primarily due to mark-to-market
activity of mitigation sales related to the Progress Energy merger.
Operating Expenses. The decrease was primarily due to lower charges
related to the Progress Energy merger and prior year Crescent Resources LLC
(Crescent) litigation reserve, partially offset by unfavorable loss experience at Bison.
Other Income and Expenses. The decrease was primarily due to a gain
on the sale of Duke Energy’s 50 percent ownership in DukeNet Communications
Holdings, LLC (DukeNet) in 2013, partially offset by a current year investment sale
gain and higher investment income at Bison Insurance Company Limited (Bison).
Interest Expense. The variance was due primarily to lower interest on long-
term debt resulting from debt maturities and new debt issued at lower rates.
Income Tax Benefi t. The variance was primarily due to a state tax benefi t
recognized in 2013. The effective tax rate for the years ended December 31,
2014 and 2013 was 41.9 percent and 58.6 percent, respectively.
Year Ended December 31, 2013 as Compared to 2012
Other’s results were positively impacted by lower charges related to the
Progress Energy merger, the sale of DukeNet, and increased current year activity
from mitigation sales related to the Progress Energy merger. These impacts were
partially offset by increased interest expense, lower income tax benefi t and the
Crescent litigation reserve in 2013. The following is a detailed discussion of the
variance drivers by line item.
Operating Revenues. The variance was driven primarily by increased
activity from mitigation sales related to the Progress Energy merger and higher
premiums earned at Bison as a result of the addition of Progress Energy.
Operating Expenses. The variance was driven primarily by lower charges
related to the Progress Energy merger, and prior year donations, partially offset
by the Crescent litigation reserve in 2013 and unfavorable loss experience at
Bison as a result of the addition of Progress Energy.
Other Income and Expense, net. The variance was driven primarily by a
gain on the sale of Duke Energy’s 50 percent ownership in DukeNet in 2013.
Interest Expense. The variance was due primarily to the inclusion of
Progress Energy for the fi rst six months of 2013 and additional debt issuances.
Income Tax Benefi t. The variance was primarily due to a decrease in
pretax loss. The effective tax rates for the years ended December 31, 2013 and
2012 were 58.6 percent and 42.5 percent, respectively.
Matters Impacting Future Other Results
Duke Energy previously held an effective 50 percent interest in Crescent
Resources, LLC (Crescent). Crescent was a real estate joint venture formed by
Duke Energy in 2006 that fi led for Chapter 11 bankruptcy protection in June 2009.
On June 9, 2010, Crescent restructured and emerged from bankruptcy and Duke
Energy forfeited its entire 50 percent ownership interest to Crescent debt holders.
This forfeiture caused Duke Energy to recognize a loss, for tax purposes, on its
interest in the second quarter of 2010. Although Crescent has reorganized and
emerged from bankruptcy with creditors owning all Crescent interest, there remains
uncertainty as to the tax treatment associated with the restructuring. Based on
this uncertainty, it is possible that Duke Energy could incur a future tax liability
related to the tax losses associated with its partnership interest in Crescent and the
resolution of issues associated with Crescent’s emergence from bankruptcy.
In 2013, a FERC Administrative Law Judge issued an initial decision
holding that Duke Energy is responsible for costs associated with Multi Value
Projects (MVP), a type of Transmission Expansion Planning (MTEP) cost,
approved by MISO prior to the date of Duke Energy’s withdrawal. The initial
decision will be reviewed by FERC. If FERC upholds the initial decision, Duke
Energy intends to fi le an appeal in federal court. If Duke Energy is deemed
responsible for these costs, and if a portion of these costs are not eligible for
recovery, there may be an adverse impact to its fi nancial position, results of
operations and cash fl ows. See Note 4 to the Consolidated Financial Statements,
“Regulatory Matters,” for additional information.
INCOME (LOSS) FROM DISCONTINUED OPERATIONS, NET OF TAX
Discontinued Operations decreased $662 million for the year ended
December 31, 2014, compared to the same period in the prior year, primarily
due to a $929 million pretax write-down of the carrying amount of the assets to
the estimated fair value of the Disposal Group, based on the transaction price
included in the PSA, less estimated costs to sell and a $134 million pretax
mark-to-market loss on economic hedges for the Disposal Group. Included in the
variance is the $117 million impact of ceasing depreciation on the assets of the
Disposal Group beginning in the second quarter of 2014.
Discontinued Operations decreased $85 million for the year ended
December 31, 2013 compared to the same period in the prior year, primarily
due to a reduction in PJM capacity revenues related to lower average cleared
capacity auction pricing for the Disposal Group.