Duke Energy 2014 Annual Report Download - page 170
Download and view the complete annual report
Please find page 170 of the 2014 Duke Energy annual report below. You can navigate through the pages in the report by either clicking on the pages listed below, or by using the keyword search tool below to find specific information within the annual report.-
 1
1 -
2
-
3
-
4
-
5
-
6
-
7
-
8
-
9
-
10
-
11
-
12
-
13
-
14
-
15
-
16
-
17
-
18
-
19
-
20
-
21
-
22
-
23
-
24
-
25
-
26
-
27
-
28
-
29
-
30
-
31
-
32
-
33
-
34
-
35
-
36
-
37
-
38
-
39
-
40
-
41
-
42
-
43
-
44
-
45
-
46
-
47
-
48
-
49
-
50
-
51
-
52
-
53
-
54
-
55
-
56
-
57
-
58
-
59
-
60
-
61
-
62
-
63
-
64
-
65
-
66
-
67
-
68
-
69
-
70
-
71
-
72
-
73
-
74
-
75
-
76
-
77
-
78
-
79
-
80
-
81
-
82
-
83
-
84
-
85
-
86
-
87
-
88
-
89
-
90
-
91
-
92
-
93
-
94
-
95
-
96
-
97
-
98
-
99
-
100
-
101
-
102
-
103
-
104
-
105
-
106
-
107
-
108
-
109
-
110
-
111
-
112
-
113
-
114
-
115
-
116
-
117
-
118
-
119
-
120
-
121
-
122
-
123
-
124
-
125
-
126
-
127
-
128
-
129
-
130
-
131
-
132
-
133
-
134
-
135
-
136
-
137
-
138
-
139
-
140
-
141
-
142
-
143
-
144
-
145
-
146
-
147
-
148
-
149
-
150
-
151
-
152
-
153
-
154
-
155
-
156
-
157
-
158
-
159
-
 160
160 -
 161
161 -
 162
162 -
 163
163 -
 164
164 -
 165
165 -
 166
166 -
 167
167 -
 168
168 -
 169
169 -
 170
170 -
 171
171 -
 172
172 -
 173
173 -
 174
174 -
 175
175 -
 176
176 -
 177
177 -
 178
178 -
 179
179 -
 180
180 -
181
-
182
-
183
-
184
-
185
-
186
-
187
-
188
-
189
-
190
-
191
-
192
-
193
-
194
-
195
-
196
-
197
-
198
-
199
-
200
-
201
-
202
-
203
-
204
-
205
-
206
-
207
-
208
-
209
-
210
-
211
-
212
-
213
-
214
-
215
-
216
-
217
-
218
-
219
-
220
-
221
-
222
-
223
-
224
-
225
-
226
-
227
-
228
-
229
-
230
-
231
-
232
-
233
-
234
-
235
-
236
-
237
-
238
-
239
-
240
-
241
-
242
-
243
-
244
-
245
-
246
-
247
-
248
-
249
-
250
-
251
-
252
-
253
-
254
-
255
-
256
-
257
-
258
-
259
-
260
-
261
-
262
-
263
-
264
 |
 |

150
PART II
DUKE ENERGY CORPORATION • DUKE ENERGY CAROLINAS, LLC • PROGRESS ENERGY, INC. •
DUKE ENERGY PROGRESS, INC. • DUKE ENERGY FLORIDA, INC. • DUKE ENERGY OHIO, INC. • DUKE ENERGY INDIANA, INC.
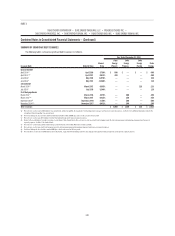
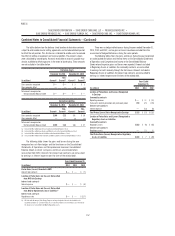
Combined Notes to Consolidated Financial Statements – (Continued)
December 31, 2013
(in millions)
Duke
Energy
Duke
Energy
Carolinas
Progress
Energy
Duke
Energy
Progress
Duke
Energy
Florida
Duke
Energy
Ohio
Duke
Energy
Indiana
Emission allowances $ 63 $ 1 $ 21 $ 3 $ 18 $ 20 $ 21
Renewable energy certifi cates 82 16 64 64 — 2 —
Gas, coal and power contracts 180 — — — — 156 24
Wind development rights 86 — — — — — —
Other 76 — — — — — —
Total gross carrying amounts 487 17 85 67 18 178 45
Accumulated amortization – gas, coal and power contracts (73) — — — — (60) (13)
Accumulated amortization – wind development rights (12) — — — — — —
Accumulated amortization – other (24) — — — — — —
Total accumulated amortization (109) — — — — (60) (13)
Total intangible assets, net $ 378 $ 17 $ 85 $ 67 $ 18 $ 118 $ 32
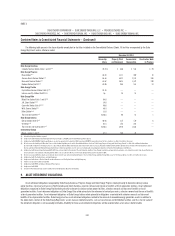
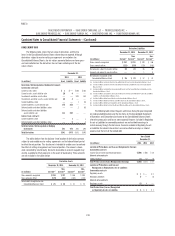
Amortization Expense
The following table presents amortization expense for gas, coal and power
contracts, wind development rights and other intangible assets.
December 31,
(in millions) 2014 2013 2012
Duke Energy $6 $13 $14
Duke Energy Ohio 2812
Duke Energy Indiana 111
The table below shows the expected amortization expense for the next fi ve
years for intangible assets as of December 31, 2014. The expected amortization
expense includes estimates of emission allowances consumption and estimates
of consumption of commodities such as gas and coal under existing contracts,
as well as estimated amortization related to the wind development projects.
The amortization amounts discussed below are estimates and actual amounts
may differ from these estimates due to such factors as changes in consumption
patterns, sales or impairments of emission allowances or other intangible
assets, delays in the in-service dates of wind assets, additional intangible
acquisitions and other events.
(in millions) 2015 2016 2017 2018 2019
Duke Energy $11 $8 $7 $7 $7
Duke Energy Ohio 2 1 1 1 1
Duke Energy Indiana 5 3 2 2 2
12. INVESTMENTS IN UNCONSOLIDATED AFFILIATES
EQUITY METHOD INVESTMENTS
Investments in domestic and international affi liates that are not controlled
by Duke Energy, but over which it has signifi cant infl uence, are accounted for
using the equity method. As of December 31, 2014 and 2013, the carrying
amount of investments in affi liates with carrying amounts greater than zero
approximated the amount of underlying equity in net assets.
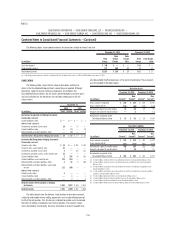
The following table presents Duke Energy’s investments in unconsolidated affi liates accounted for under the equity method, as well as the respective equity in
earnings, by segment.
Years Ended December 31,
2014 2013 2012
(in millions) Investments Equity in earnings Investments Equity in earnings Equity in earnings
Regulated Utilities $ 3 $ (3) $ 4 $ (1) $ (5)
International Energy 69 120 82 110 134
Commercial Power 258 10 252 7 14
Other 28 3 52 6 5
Total $ 358 $ 130 $ 390 $ 122 $ 148
During the years ended December 31, 2014, 2013 and 2012, Duke Energy
received distributions from equity investments of $154 million, $144 million and
$183 million, respectively, which are included in Other assets within Cash Flows
from Operating Activities on the Consolidated Statements of Cash Flows.
Signifi cant investments in affi liates accounted for under the equity
method are discussed below.
International Energy
Duke Energy owns a 25 percent indirect interest in NMC, which owns and
operates a methanol and MTBE business in Jubail, Saudi Arabia.