Duke Energy 2014 Annual Report Download - page 134
Download and view the complete annual report
Please find page 134 of the 2014 Duke Energy annual report below. You can navigate through the pages in the report by either clicking on the pages listed below, or by using the keyword search tool below to find specific information within the annual report.-
 1
1 -
2
-
3
-
4
-
5
-
6
-
7
-
8
-
9
-
10
-
11
-
12
-
13
-
14
-
15
-
16
-
17
-
18
-
19
-
20
-
21
-
22
-
23
-
24
-
25
-
26
-
27
-
28
-
29
-
30
-
31
-
32
-
33
-
34
-
35
-
36
-
37
-
38
-
39
-
40
-
41
-
42
-
43
-
44
-
45
-
46
-
47
-
48
-
49
-
50
-
51
-
52
-
53
-
54
-
55
-
56
-
57
-
58
-
59
-
60
-
61
-
62
-
63
-
64
-
65
-
66
-
67
-
68
-
69
-
70
-
71
-
72
-
73
-
74
-
75
-
76
-
77
-
78
-
79
-
80
-
81
-
82
-
83
-
84
-
85
-
86
-
87
-
88
-
89
-
90
-
91
-
92
-
93
-
94
-
95
-
96
-
97
-
98
-
99
-
100
-
101
-
102
-
103
-
104
-
105
-
106
-
107
-
108
-
109
-
110
-
111
-
112
-
113
-
114
-
115
-
116
-
117
-
118
-
119
-
120
-
121
-
122
-
123
-
 124
124 -
 125
125 -
 126
126 -
 127
127 -
 128
128 -
 129
129 -
 130
130 -
 131
131 -
 132
132 -
 133
133 -
 134
134 -
 135
135 -
 136
136 -
 137
137 -
 138
138 -
 139
139 -
 140
140 -
 141
141 -
 142
142 -
 143
143 -
 144
144 -
145
-
146
-
147
-
148
-
149
-
150
-
151
-
152
-
153
-
154
-
155
-
156
-
157
-
158
-
159
-
160
-
161
-
162
-
163
-
164
-
165
-
166
-
167
-
168
-
169
-
170
-
171
-
172
-
173
-
174
-
175
-
176
-
177
-
178
-
179
-
180
-
181
-
182
-
183
-
184
-
185
-
186
-
187
-
188
-
189
-
190
-
191
-
192
-
193
-
194
-
195
-
196
-
197
-
198
-
199
-
200
-
201
-
202
-
203
-
204
-
205
-
206
-
207
-
208
-
209
-
210
-
211
-
212
-
213
-
214
-
215
-
216
-
217
-
218
-
219
-
220
-
221
-
222
-
223
-
224
-
225
-
226
-
227
-
228
-
229
-
230
-
231
-
232
-
233
-
234
-
235
-
236
-
237
-
238
-
239
-
240
-
241
-
242
-
243
-
244
-
245
-
246
-
247
-
248
-
249
-
250
-
251
-
252
-
253
-
254
-
255
-
256
-
257
-
258
-
259
-
260
-
261
-
262
-
263
-
264
 |
 |

114
PART II
DUKE ENERGY CORPORATION • DUKE ENERGY CAROLINAS, LLC • PROGRESS ENERGY, INC. •
DUKE ENERGY PROGRESS, INC. • DUKE ENERGY FLORIDA, INC. • DUKE ENERGY OHIO, INC. • DUKE ENERGY INDIANA, INC.
Combined Notes to Consolidated Financial Statements – (Continued)
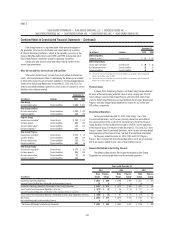
The following table presents the Disposal Group’s carrying values in the
Consolidated Balance Sheets’ major classes of Assets held for sale.
December 31, 2014
(in millions) Duke Energy
Duke Energy
Ohio
Current assets $ 364 $ 316
Investments and other assets 52 46
Property, plant and equipment 2,590 2,559
Total assets held for sale $ 3,006 $ 2,921
Current liabilities $ 262 $ 246
Deferred credits and other liabilities 35 34
Total liabilities associated with assets held for sale $ 297 $ 280
Duke Energy Ohio may continue to have transactions with the Disposal
Group after the divestiture is complete depending on when the transaction
closes. Duke Energy Ohio has a power purchase agreement with the Disposal
Group, which extends through May 2015, for a portion of its standard service
offer (SSO) supply requirement. In addition, for a period of up to 12 months,
Duke Energy may provide transition services to Dynegy. Duke Energy will be
reimbursed for transition services provided. The continuing cash fl ows are
not expected to be material and are not considered direct cash fl ows. These
arrangements do not allow Duke Energy or Duke Energy Ohio to signifi cantly
infl uence the operations of the Disposal Group once the sale is complete.
See Notes 4 and 5 for a discussion of contingencies related to the Disposal
Group that will be retained by Duke Energy Ohio subsequent to the sale.
Vermillion Generating Station
On January 12, 2012, after receiving approvals from the FERC and IURC on
August 12, 2011 and December 28, 2011, respectively, Duke Energy Vermillion II,
LLC (Duke Energy Vermillion), an indirect wholly owned subsidiary of Duke Energy
Ohio, completed the sale of its ownership interest in Vermillion Generating Station
(Vermillion) to Duke Energy Indiana and Wabash Valley Power Association, Inc.
(WVPA). Upon closing of the sale, Duke Energy Indiana held a 62.5 percent
interest in Vermillion. Duke Energy Ohio received net proceeds of $82 million, of
which $68 million was paid by Duke Energy Indiana. Following the transaction,
Duke Energy Indiana retired Gallagher Units 1 and 3 effective February 1, 2012.
As Duke Energy Indiana is an affi liate of Duke Energy Vermillion, the
transaction was accounted for as a transfer between entities under common
control with no gain or loss recorded and did not have a signifi cant impact to
Duke Energy Ohio’s or Duke Energy Indiana’s results of operations. Proceeds
received from Duke Energy Indiana are included in Net proceeds from the sales
of other assets on Duke Energy Ohio’s Consolidated Statements of Cash Flows.
Cash paid to Duke Energy Ohio is included in Capital expenditures on Duke
Energy Indiana’s Consolidated Statements of Cash Flows. Duke Energy Ohio
and Duke Energy Indiana recognized non-cash equity transfers of $28 million
and $26 million, respectively, in their Consolidated Statements of Common
Stockholder’s Equity on the transaction representing the difference between cash
exchanged and the net book value of Vermillion. These amounts are not refl ected
in Duke Energy’s Consolidated Statements of Cash Flows or Consolidated
Statements of Equity as the transaction is eliminated in consolidation.
Proceeds from WVPA are included in Net proceeds from the sales of other
assets on Duke Energy Ohio’s Consolidated Statements of Cash Flows and Net
proceeds from the sales of equity investments and other assets, and sales of
and collections on notes receivable on Duke Energy’s Consolidated Statements
of Cash Flows. The sale of the proportionate share of Vermillion to WVPA did not
result in a signifi cant gain or loss upon close of the transaction.
SALES OF OTHER ASSETS
During 2012, Duke Energy received proceeds of $187 million from the sale
of non-core business assets within the Commercial Power segment for which no
material gain or loss was recognized.
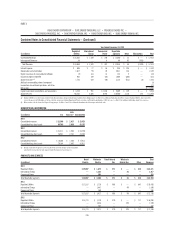
3. BUSINESS SEGMENTS
Duke Energy evaluates segment performance based on segment income.
Segment income is defi ned as income from continuing operations net of income
attributable to noncontrolling interests. Segment income, as discussed below,
includes intercompany revenues and expenses that are eliminated in the
Consolidated Financial Statements. Certain governance costs are allocated
to each segment. In addition, direct interest expense and income taxes are
included in segment income.
Operating segments are determined based on information used by the
chief operating decision maker in deciding how to allocate resources and
evaluate the performance.
Products and services are sold between affi liate companies and
reportable segments of Duke Energy at cost. Segment assets as presented in the
tables that follow exclude all intercompany assets.
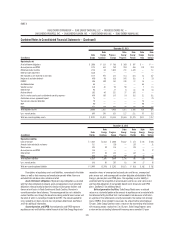
DUKE ENERGY
Duke Energy has the following reportable operating segments: Regulated
Utilities, International Energy and Commercial Power.
Regulated Utilities conducts operations primarily through Duke Energy
Carolinas, Duke Energy Progress, Duke Energy Florida, Duke Energy Indiana,
and the regulated transmission and distribution operations of Duke Energy
Ohio. These electric and natural gas operations are subject to the rules
and regulations of the FERC, NCUC, PSCSC, FPSC, PUCO, IURC and KPSC.
Substantially all of Regulated Utilities’ operations are regulated and, accordingly,
these operations qualify for regulatory accounting treatment.
International Energy principally operates and manages power generation
facilities and engages in sales and marketing of electric power, natural gas
and natural gas liquids outside the U.S. Its activities principally target power
generation in Latin America. Additionally, International Energy owns a 25
percent interest in National Methanol Company (NMC), a large regional producer
of methyl tertiary butyl ether (MTBE) located in Saudi Arabia. The investment in
NMC is accounted for under the equity method of accounting.
Commercial Power builds, develops and operates renewable generation
and energy transmission projects throughout the continental U.S. As discussed
in Note 2, Duke Energy entered into an agreement to sell Commercial Power’s
nonregulated Midwest generation business to Dynegy in a transaction that
is expected to close during the second quarter of 2015. As a result of this
divestiture, the results of operations of the nonregulated Midwest generation
business have been reclassifi ed to Discontinued Operations on the Consolidated
Statements of Operations. Certain costs such as interest and general and
administrative expenses previously allocated to the Disposal Group were not
reclassifi ed to discontinued operations.
The remainder of Duke Energy’s operations is presented as Other. While
it is not an operating segment, Other primarily includes unallocated corporate
interest expense, certain unallocated corporate costs, Bison Insurance Company
Limited (Bison), Duke Energy’s wholly owned, captive insurance subsidiary,
and contributions to the Duke Energy Foundation. On December 31, 2013, Duke
Energy sold its interest in DukeNet Communications Holdings, LLC (DukeNet) to
Time Warner Cable, Inc.