Duke Energy 2014 Annual Report Download - page 167
Download and view the complete annual report
Please find page 167 of the 2014 Duke Energy annual report below. You can navigate through the pages in the report by either clicking on the pages listed below, or by using the keyword search tool below to find specific information within the annual report.-
 1
1 -
2
-
3
-
4
-
5
-
6
-
7
-
8
-
9
-
10
-
11
-
12
-
13
-
14
-
15
-
16
-
17
-
18
-
19
-
20
-
21
-
22
-
23
-
24
-
25
-
26
-
27
-
28
-
29
-
30
-
31
-
32
-
33
-
34
-
35
-
36
-
37
-
38
-
39
-
40
-
41
-
42
-
43
-
44
-
45
-
46
-
47
-
48
-
49
-
50
-
51
-
52
-
53
-
54
-
55
-
56
-
57
-
58
-
59
-
60
-
61
-
62
-
63
-
64
-
65
-
66
-
67
-
68
-
69
-
70
-
71
-
72
-
73
-
74
-
75
-
76
-
77
-
78
-
79
-
80
-
81
-
82
-
83
-
84
-
85
-
86
-
87
-
88
-
89
-
90
-
91
-
92
-
93
-
94
-
95
-
96
-
97
-
98
-
99
-
100
-
101
-
102
-
103
-
104
-
105
-
106
-
107
-
108
-
109
-
110
-
111
-
112
-
113
-
114
-
115
-
116
-
117
-
118
-
119
-
120
-
121
-
122
-
123
-
124
-
125
-
126
-
127
-
128
-
129
-
130
-
131
-
132
-
133
-
134
-
135
-
136
-
137
-
138
-
139
-
140
-
141
-
142
-
143
-
144
-
145
-
146
-
147
-
148
-
149
-
150
-
151
-
152
-
153
-
154
-
155
-
156
-
 157
157 -
 158
158 -
 159
159 -
 160
160 -
 161
161 -
 162
162 -
 163
163 -
 164
164 -
 165
165 -
 166
166 -
 167
167 -
 168
168 -
 169
169 -
 170
170 -
 171
171 -
 172
172 -
 173
173 -
 174
174 -
 175
175 -
 176
176 -
 177
177 -
178
-
179
-
180
-
181
-
182
-
183
-
184
-
185
-
186
-
187
-
188
-
189
-
190
-
191
-
192
-
193
-
194
-
195
-
196
-
197
-
198
-
199
-
200
-
201
-
202
-
203
-
204
-
205
-
206
-
207
-
208
-
209
-
210
-
211
-
212
-
213
-
214
-
215
-
216
-
217
-
218
-
219
-
220
-
221
-
222
-
223
-
224
-
225
-
226
-
227
-
228
-
229
-
230
-
231
-
232
-
233
-
234
-
235
-
236
-
237
-
238
-
239
-
240
-
241
-
242
-
243
-
244
-
245
-
246
-
247
-
248
-
249
-
250
-
251
-
252
-
253
-
254
-
255
-
256
-
257
-
258
-
259
-
260
-
261
-
262
-
263
-
264
 |
 |

147
PART II
DUKE ENERGY CORPORATION • DUKE ENERGY CAROLINAS, LLC • PROGRESS ENERGY, INC. •
DUKE ENERGY PROGRESS, INC. • DUKE ENERGY FLORIDA, INC. • DUKE ENERGY OHIO, INC. • DUKE ENERGY INDIANA, INC.
Combined Notes to Consolidated Financial Statements – (Continued)
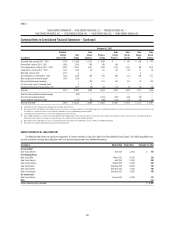
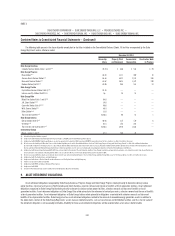
10. PROPERTY, PLANT AND EQUIPMENT
The following tables summarize the property, plant and equipment.
December 31, 2014
(in millions)
Estimated
Useful Life
(Years)
Duke
Energy
Duke
Energy
Carolinas
Progress
Energy
Duke
Energy
Progress
Duke
Energy
Florida
Duke
Energy
Ohio
Duke
Energy
Indiana
Land $ 1,459 $ 403 $ 704 $ 380 $ 324 $ 114 $ 108
Plant – Regulated
Electric generation, distribution and transmission 2 – 138 82,206 31,751 33,672 20,616 13,056 3,956 11,911
Natural gas transmission and distribution 12 – 67 2,230 — — — — 2,230 —
Other buildings and improvements 9 – 100 1,445 465 607 286 318 200 173
Plant – Nonregulated
Electric generation, distribution and transmission 1 – 30 2,380 — — — — — —
Other buildings and improvements 5 – 50 2,498 — — — — — —
Nuclear fuel 2,865 1,676 1,190 1,190 — — —
Equipment 3 – 34 1,762 341 506 388 118 330 166
Construction in process 4,519 2,081 1,215 908 307 97 481
Other 5 – 80 3,497 655 756 439 310 214 195
Total property, plant and equipment(a)(d) 104,861 37,372 38,650 24,207 14,433 7,141 13,034
Total accumulated depreciation – regulated(b)(c)(d) (32,628) (12,700) (13,506) (9,021) (4,478) (2,213) (4,219)
Total accumulated depreciation – nonregulated(c)(d) (2,196) — — — — — —
Generation facilities to be retired, net 9———— 9—
Total net property, plant and equipment $ 70,046 $ 24,672 $ 25,144 $15,186 $ 9,955 $ 4,937 $ 8,815
(a) Includes capitalized leases of $1,548 million, $40 million, $315 million, $146 million, $169 million, $98 million, and $30 million at Duke Energy, Duke Energy Carolinas, Progress Energy, Duke Energy Progress, Duke Energy
Florida, Duke Energy Ohio, and Duke Energy Indiana, respectively, primarily in regulated plant. The Progress Energy, Duke Energy Progress and Duke Energy Florida amounts are net of $72 million, $5 million and $67 million,
respectively, of accumulated amortization of capitalized leases.
(b) Includes $1,408 million, $847 million, $561 million and $561 million of accumulated amortization of nuclear fuel at Duke Energy, Duke Energy Carolinas, Progress Energy and Duke Energy Progress, respectively.
(c) Includes accumulated amortization of capitalized leases of $52 million, $8 million, $25 million and $6 million at Duke Energy, Duke Energy Carolinas, Duke Energy Ohio and Duke Energy Indiana, respectively.
(d) Includes gross property, plant and equipment cost of consolidated VIEs of $1,873 million and accumulated depreciation of consolidated VIEs of $257 million at Duke Energy.