Duke Energy 2014 Annual Report Download - page 226
Download and view the complete annual report
Please find page 226 of the 2014 Duke Energy annual report below. You can navigate through the pages in the report by either clicking on the pages listed below, or by using the keyword search tool below to find specific information within the annual report.-
 1
1 -
2
-
3
-
4
-
5
-
6
-
7
-
8
-
9
-
10
-
11
-
12
-
13
-
14
-
15
-
16
-
17
-
18
-
19
-
20
-
21
-
22
-
23
-
24
-
25
-
26
-
27
-
28
-
29
-
30
-
31
-
32
-
33
-
34
-
35
-
36
-
37
-
38
-
39
-
40
-
41
-
42
-
43
-
44
-
45
-
46
-
47
-
48
-
49
-
50
-
51
-
52
-
53
-
54
-
55
-
56
-
57
-
58
-
59
-
60
-
61
-
62
-
63
-
64
-
65
-
66
-
67
-
68
-
69
-
70
-
71
-
72
-
73
-
74
-
75
-
76
-
77
-
78
-
79
-
80
-
81
-
82
-
83
-
84
-
85
-
86
-
87
-
88
-
89
-
90
-
91
-
92
-
93
-
94
-
95
-
96
-
97
-
98
-
99
-
100
-
101
-
102
-
103
-
104
-
105
-
106
-
107
-
108
-
109
-
110
-
111
-
112
-
113
-
114
-
115
-
116
-
117
-
118
-
119
-
120
-
121
-
122
-
123
-
124
-
125
-
126
-
127
-
128
-
129
-
130
-
131
-
132
-
133
-
134
-
135
-
136
-
137
-
138
-
139
-
140
-
141
-
142
-
143
-
144
-
145
-
146
-
147
-
148
-
149
-
150
-
151
-
152
-
153
-
154
-
155
-
156
-
157
-
158
-
159
-
160
-
161
-
162
-
163
-
164
-
165
-
166
-
167
-
168
-
169
-
170
-
171
-
172
-
173
-
174
-
175
-
176
-
177
-
178
-
179
-
180
-
181
-
182
-
183
-
184
-
185
-
186
-
187
-
188
-
189
-
190
-
191
-
192
-
193
-
194
-
195
-
196
-
197
-
198
-
199
-
200
-
201
-
202
-
203
-
204
-
205
-
206
-
207
-
208
-
209
-
210
-
211
-
212
-
213
-
214
-
215
-
 216
216 -
 217
217 -
 218
218 -
 219
219 -
 220
220 -
 221
221 -
 222
222 -
 223
223 -
 224
224 -
 225
225 -
 226
226 -
 227
227 -
 228
228 -
 229
229 -
 230
230 -
 231
231 -
 232
232 -
 233
233 -
 234
234 -
 235
235 -
 236
236 -
237
-
238
-
239
-
240
-
241
-
242
-
243
-
244
-
245
-
246
-
247
-
248
-
249
-
250
-
251
-
252
-
253
-
254
-
255
-
256
-
257
-
258
-
259
-
260
-
261
-
262
-
263
-
264
 |
 |

206
PART II
DUKE ENERGY CORPORATION • DUKE ENERGY CAROLINAS, LLC • PROGRESS ENERGY, INC. •
DUKE ENERGY PROGRESS, INC. • DUKE ENERGY FLORIDA, INC. • DUKE ENERGY OHIO, INC. • DUKE ENERGY INDIANA, INC.
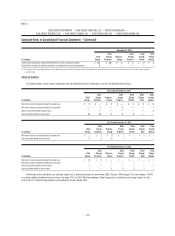
Combined Notes to Consolidated Financial Statements – (Continued)
Valuation allowances have been established for certain foreign and state NOL carryforwards and state income tax credits that reduce deferred tax assets to an
amount that will be realized on a more-likely-than-not basis. The net change in the total valuation allowance is included in Tax differential on foreign earnings and
State income tax, net of federal income tax effect in the above tables.
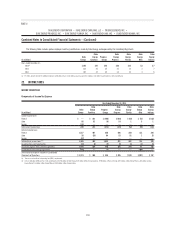
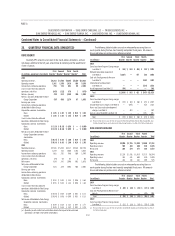
DEFERRED TAXES
Net Deferred Income Tax Liability Components
December 31, 2014
(in millions)
Duke
Energy
Duke
Energy
Carolinas
Progress
Energy
Duke
Energy
Progress
Duke
Energy
Florida
Duke
Energy
Ohio
Duke
Energy
Indiana
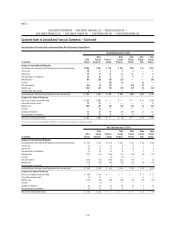
Deferred credits and other liabilities $ 188 $ 53 $ 108 $ 28 $ 78 $ (8) $ 12
Capital lease obligations 63 10 — — — — 2
Pension, post-retirement and other employee benefi ts 546 4 188 96 93 17 43
Progress Energy merger purchase accounting adjustments(a) 1,124 — — — — — —
Tax credits and NOL carryforwards 3,540 157 980 91 252 38 260
Investments and other assets —— — ——14—
Other — 12 — 55 — 35 11
Valuation allowance (184) — (13) (1) — — —
Total deferred income tax assets 5,277 236 1,263 269 423 96 328
Investments and other assets (1,625) (1,051) (427) (232) (245) — (4)
Accelerated depreciation rates (11,715) (4,046) (3,284) (2,030) (1,252) (1,660) (1,603)
Regulatory assets and deferred debits (3,694) (953) (1,602) (809) (792) (141) (106)
Other (44) — (151) — (246) — —
Total deferred income tax liabilities (17,078) (6,050) (5,464) (3,071) (2,535) (1,801) (1,713)
Net deferred income tax liabilities $(11,801) $(5,814) $(4,201) $(2,802) $(2,112) $(1,705) $(1,385)
(a) Primarily related to capital lease obligations and debt fair value adjustments.
On July 23, 2013, HB 998 was signed into law. HB 998 reduces the North
Carolina corporate income tax rate from a statutory 6.9 to 6.0 percent in January
2014 with a further reduction to 5.0 percent in January 2015. Duke Energy
recorded a net reduction of approximately $145 million to its North Carolina
deferred tax liability in the third quarter of 2013. The signifi cant majority of
this deferred tax liability reduction was offset by recording a regulatory liability
pending NCUC determination of the disposition of the amounts related to Duke
Energy Carolinas and Duke Energy Progress. The impact of HB 998 did not
have a signifi cant impact on the fi nancial position, results of operation, or cash
fl ows of Duke Energy, Duke Energy Carolinas, Progress Energy or Duke Energy
Progress.
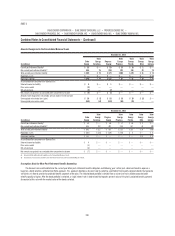
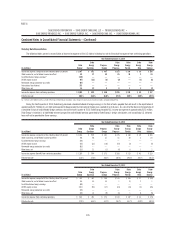
The following table presents the expiration of tax credits and NOL carryforwards.
December 31, 2014
(in millions) Amount
Expiration
Year
Investment tax credits $ 581 2029 — 2034
Alternative minimum tax credits 1,093 Indefi nite
Federal NOL carryforwards 749 2030 — 2033
State NOL carryforwards and credits(a) 162 2015 — 2034
Foreign NOL carryforwards(b) 117 2015 — 2033
Foreign Tax Credits 838 2024
Total tax credits and NOL carryforwards $ 3,540
(a) A valuation allowance of $79 million has been recorded on the state Net Operating Loss carryforwards, as presented in the Net Deferred Income Tax Liability Components table.
(b) A valuation allowance of $105 million has been recorded on the foreign Net Operating Loss carryforwards, as presented in the Net Deferred Income Tax Liability Components table.