Duke Energy 2014 Annual Report Download - page 28
Download and view the complete annual report
Please find page 28 of the 2014 Duke Energy annual report below. You can navigate through the pages in the report by either clicking on the pages listed below, or by using the keyword search tool below to find specific information within the annual report.-
 1
1 -
2
-
3
-
4
-
5
-
6
-
7
-
8
-
9
-
10
-
11
-
12
-
13
-
14
-
15
-
16
-
17
-
 18
18 -
 19
19 -
 20
20 -
 21
21 -
 22
22 -
 23
23 -
 24
24 -
 25
25 -
 26
26 -
 27
27 -
 28
28 -
 29
29 -
 30
30 -
 31
31 -
 32
32 -
 33
33 -
 34
34 -
 35
35 -
 36
36 -
 37
37 -
 38
38 -
39
-
40
-
41
-
42
-
43
-
44
-
45
-
46
-
47
-
48
-
49
-
50
-
51
-
52
-
53
-
54
-
55
-
56
-
57
-
58
-
59
-
60
-
61
-
62
-
63
-
64
-
65
-
66
-
67
-
68
-
69
-
70
-
71
-
72
-
73
-
74
-
75
-
76
-
77
-
78
-
79
-
80
-
81
-
82
-
83
-
84
-
85
-
86
-
87
-
88
-
89
-
90
-
91
-
92
-
93
-
94
-
95
-
96
-
97
-
98
-
99
-
100
-
101
-
102
-
103
-
104
-
105
-
106
-
107
-
108
-
109
-
110
-
111
-
112
-
113
-
114
-
115
-
116
-
117
-
118
-
119
-
120
-
121
-
122
-
123
-
124
-
125
-
126
-
127
-
128
-
129
-
130
-
131
-
132
-
133
-
134
-
135
-
136
-
137
-
138
-
139
-
140
-
141
-
142
-
143
-
144
-
145
-
146
-
147
-
148
-
149
-
150
-
151
-
152
-
153
-
154
-
155
-
156
-
157
-
158
-
159
-
160
-
161
-
162
-
163
-
164
-
165
-
166
-
167
-
168
-
169
-
170
-
171
-
172
-
173
-
174
-
175
-
176
-
177
-
178
-
179
-
180
-
181
-
182
-
183
-
184
-
185
-
186
-
187
-
188
-
189
-
190
-
191
-
192
-
193
-
194
-
195
-
196
-
197
-
198
-
199
-
200
-
201
-
202
-
203
-
204
-
205
-
206
-
207
-
208
-
209
-
210
-
211
-
212
-
213
-
214
-
215
-
216
-
217
-
218
-
219
-
220
-
221
-
222
-
223
-
224
-
225
-
226
-
227
-
228
-
229
-
230
-
231
-
232
-
233
-
234
-
235
-
236
-
237
-
238
-
239
-
240
-
241
-
242
-
243
-
244
-
245
-
246
-
247
-
248
-
249
-
250
-
251
-
252
-
253
-
254
-
255
-
256
-
257
-
258
-
259
-
260
-
261
-
262
-
263
-
264
 |
 |

PART I
8
Recently Completed Generation Projects
The additional capacity from recently completed generation projects allowed Regulated Utilities to retire or plan to retire older, less effi cient capacity. The following
table summarizes the generation projects constructed and placed in service during the past three years.
Megawatts Fuel
Commercial
Operation
Cost
(in millions)
Duke Energy Carolinas Cliffside Unit 6 844 Coal 2012 $ 2,100
Duke Energy Carolinas Dan River Combined Cycle 637 Natural Gas 2012 675
Duke Energy Progress H.F. Lee Combined Cycle 916 Natural Gas 2012 725
Duke Energy Progress L.V. Sutton Combined Cycle 622 Natural Gas 2013 575
Duke Energy Indiana Edwardsport IGCC 595 Coal 2013 3,550
Total 3,614 $ 7,625
Potential Plant Retirements
The Subsidiary Registrants periodically fi le Integrated Resource Plans
(IRP) with state regulatory commissions. The IRPs provide a view of forecasted
energy needs over a long term (10 to 20 years) and options being considered
to meet those needs. Recent IRPs fi led by the Subsidiary Registrants included
planning assumptions to potentially retire certain coal-fi red generating
facilities earlier than their current estimated useful lives. These facilities do
not have the requisite emission control equipment, primarily to meet United
States Environmental Protection Agency (EPA) regulations recently approved
or proposed. These facilities total approximately 1,704 MW at three sites.
Duke Energy continues to evaluate the potential need to retire these coal-fi red
generating facilities earlier than the current estimated useful lives, and plans
to seek regulatory recovery for amounts that would not be otherwise recovered
when any of these assets are retired. For additional information related to
potential plant retirements see Note 4 to the Consolidated Financial Statements,
“Regulatory Matters.”
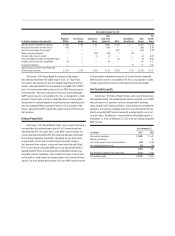
Sources of Electricity
Regulated Utilities relies principally on coal, natural gas and nuclear fuel for its generation of electricity. The following table lists sources of electricity and fuel
costs for the three years ended December 31, 2014.
Generation by Source(a)(e)
Cost of Delivered Fuel per Net
Kilowatt-hour Generated (Cents)(a)(e)
2014 2013 2012 2014 2013 2012
Coal(b) 36.5% 35.7% 39.1% 3.54 3.67 3.55
Nuclear(b) 28.4% 28.7% 30.8% 0.65 0.66 0.62
Gas and oil(b) 20.8% 21.3% 14.0% 4.70 4.18 4.03
All fuels (cost-based on weighted average)(b) 85.7% 85.7% 83.9% 2.86 2.79 2.55
Hydroelectric and solar(c) 0.9% 1.5% 0.8%
Total generation 86.6% 87.2% 84.7%
Purchased power and net interchange(d) 13.4% 12.8% 15.3%
Total sources of energy 100.0% 100.0% 100.0%
(a) Statistics include Duke Energy Progress and Duke Energy Florida beginning July 2, 2012.
(b) Statistics related to all fuels refl ect Regulated Utilities’ ownership interest in jointly owned generation facilities.
(c) Generating fi gures are net of output required to replenish pumped storage facilities during off-peak periods.
(d) Purchased power includes renewable energy purchases.
(e) Includes the effect of the Joint Dispatch Agreement (JDA) and Mitigation sales. Mitigation sales are excluded from the Regulated Utilities segment.
Coal
Regulated Utilities meets its coal demand through a portfolio of long-term
purchase contracts and short-term spot market purchase agreements. Large
amounts of coal are purchased under long-term contracts with mining operators
who mine both underground and at the surface. Regulated Utilities uses spot-
market purchases to meet coal requirements not met by long-term contracts.
Expiration dates for its long-term contracts, which have various price adjustment
provisions and market re-openers, range from 2015 to 2016 for Duke Energy
Carolinas, 2015 to 2018 for Duke Energy Progress, 2015 to 2016 for Duke Energy
Florida, and 2015 to 2025 for Duke Energy Indiana. Regulated Utilities expects
to renew these contracts or enter into similar contracts with other suppliers as
existing contracts expire, though prices will fl uctuate over time as coal markets
change. Coal purchased for the Carolinas is primarily produced from mines in
Central Appalachia, Northern Appalachia and the Illinois Basin. Coal purchased
for Florida is primarily produced from mines in Central Appalachia and the
Illinois Basin. Coal purchased for Indiana is primarily produced in Indiana and
Illinois. Regulated Utilities has an adequate supply of coal under contract to
fuel its projected 2015 operations and a signifi cant portion of supply to fuel its
projected 2016 operations. Current coal inventory levels for Regulated Utilities
are at adequate levels and are expected to remain at adequate levels for the
remainder of 2015. Changing natural gas prices continue to infl uence the level of
coal generation.
The current average sulfur content of coal purchased by Regulated Utilities
is between 1.5 percent and 2 percent for Duke Energy Carolinas, between
1.5 percent and 2 percent for Duke Energy Progress, between 1 percent and
2.5 percent for Duke Energy Florida, and between 2 percent and 3 percent for
Duke Energy Indiana. Regulated Utilities’ environmental controls, in combination
with the use of sulfur dioxide (SO2) emission allowances, enable Regulated
Utilities to satisfy current SO2 emission limitations for its existing facilities.