Duke Energy 2014 Annual Report Download - page 138
Download and view the complete annual report
Please find page 138 of the 2014 Duke Energy annual report below. You can navigate through the pages in the report by either clicking on the pages listed below, or by using the keyword search tool below to find specific information within the annual report.-
 1
1 -
2
-
3
-
4
-
5
-
6
-
7
-
8
-
9
-
10
-
11
-
12
-
13
-
14
-
15
-
16
-
17
-
18
-
19
-
20
-
21
-
22
-
23
-
24
-
25
-
26
-
27
-
28
-
29
-
30
-
31
-
32
-
33
-
34
-
35
-
36
-
37
-
38
-
39
-
40
-
41
-
42
-
43
-
44
-
45
-
46
-
47
-
48
-
49
-
50
-
51
-
52
-
53
-
54
-
55
-
56
-
57
-
58
-
59
-
60
-
61
-
62
-
63
-
64
-
65
-
66
-
67
-
68
-
69
-
70
-
71
-
72
-
73
-
74
-
75
-
76
-
77
-
78
-
79
-
80
-
81
-
82
-
83
-
84
-
85
-
86
-
87
-
88
-
89
-
90
-
91
-
92
-
93
-
94
-
95
-
96
-
97
-
98
-
99
-
100
-
101
-
102
-
103
-
104
-
105
-
106
-
107
-
108
-
109
-
110
-
111
-
112
-
113
-
114
-
115
-
116
-
117
-
118
-
119
-
120
-
121
-
122
-
123
-
124
-
125
-
126
-
127
-
 128
128 -
 129
129 -
 130
130 -
 131
131 -
 132
132 -
 133
133 -
 134
134 -
 135
135 -
 136
136 -
 137
137 -
 138
138 -
 139
139 -
 140
140 -
 141
141 -
 142
142 -
 143
143 -
 144
144 -
 145
145 -
 146
146 -
 147
147 -
 148
148 -
149
-
150
-
151
-
152
-
153
-
154
-
155
-
156
-
157
-
158
-
159
-
160
-
161
-
162
-
163
-
164
-
165
-
166
-
167
-
168
-
169
-
170
-
171
-
172
-
173
-
174
-
175
-
176
-
177
-
178
-
179
-
180
-
181
-
182
-
183
-
184
-
185
-
186
-
187
-
188
-
189
-
190
-
191
-
192
-
193
-
194
-
195
-
196
-
197
-
198
-
199
-
200
-
201
-
202
-
203
-
204
-
205
-
206
-
207
-
208
-
209
-
210
-
211
-
212
-
213
-
214
-
215
-
216
-
217
-
218
-
219
-
220
-
221
-
222
-
223
-
224
-
225
-
226
-
227
-
228
-
229
-
230
-
231
-
232
-
233
-
234
-
235
-
236
-
237
-
238
-
239
-
240
-
241
-
242
-
243
-
244
-
245
-
246
-
247
-
248
-
249
-
250
-
251
-
252
-
253
-
254
-
255
-
256
-
257
-
258
-
259
-
260
-
261
-
262
-
263
-
264
 |
 |

118
PART II
DUKE ENERGY CORPORATION • DUKE ENERGY CAROLINAS, LLC • PROGRESS ENERGY, INC. •
DUKE ENERGY PROGRESS, INC. • DUKE ENERGY FLORIDA, INC. • DUKE ENERGY OHIO, INC. • DUKE ENERGY INDIANA, INC.
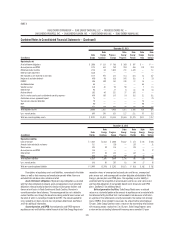
Combined Notes to Consolidated Financial Statements – (Continued)
Year Ended December 31, 2012
(in millions)
Regulated
Utilities
Commercial
Power
Total
Reportable
Segments Other Eliminations Total
Unaffi liated revenues $ 1,745 $ 75 $ 1,820 $ — $ — $ 1,820
Intersegment revenues 1 1 2 — (2) —
Total revenues $ 1,746 $ 76 $ 1,822 $ — $ (2) $ 1,820
Interest expense $ 61 $ 28 $ 89 $ — $ — $ 89
Depreciation and amortization 179 16 195 — — 195
Income tax expense (benefi t) 91 (40) 51 (18) — 33
Segment income (loss) 159 (80) 79 (34) — 45
Income from discontinued operations, net of tax 130
Net income $ 175
Capital expenditures $ 427 $ 87 $ 514 $ — $ — $ 514
Segment assets 6,434 4,175 10,609 117 (166) 10,560
DUKE ENERGY CAROLINAS, PROGRESS ENERGY, DUKE ENERGY PROGRESS,
DUKE ENERGY FLORIDA AND DUKE ENERGY INDIANA
Duke Energy Carolinas, Progress Energy, Duke Energy Progress, Duke
Energy Florida and Duke Energy Indiana each have one reportable operating
segment, Regulated Utility, which generates, transmits, distributes and sells
electricity. The remainder of each company’s operations is classifi ed as Other.
While not considered a reportable segment for any of these companies, Other
consists of certain unallocated corporate costs. Other for Progress Energy
also includes interest expense on corporate debt instruments of $241 million,
$300 million and $304 million for the years ended December 31, 2014, 2013
and 2012. The following table summarizes the net loss for Other for each of
these entities.
Years Ended December 31,
(in millions) 2014 2013 2012
Duke Energy Carolinas $ (79) $ (97) $ (169)
Progress Energy (190) (241) (379)
Duke Energy Progress (31) (46) (139)
Duke Energy Florida (19) (24) (58)
Duke Energy Indiana (11)(16) (27)
Duke Energy Progress earned approximately 11 percent of its consolidated
operating revenues from North Carolina Electric Membership Corporation
(NCEMC) in 2014. These revenues relate to wholesale contracts and
transmission revenues. The respective Regulated Utility and Regulated Utilities
operating segments own substantially all of Duke Energy Carolinas’, Progress
Energy’s, Duke Energy Progress’, Duke Energy Florida’s and Duke Energy
Indiana’s assets at December 31, 2014, 2013 and 2012.