Duke Energy 2014 Annual Report Download - page 48
Download and view the complete annual report
Please find page 48 of the 2014 Duke Energy annual report below. You can navigate through the pages in the report by either clicking on the pages listed below, or by using the keyword search tool below to find specific information within the annual report.-
 1
1 -
2
-
3
-
4
-
5
-
6
-
7
-
8
-
9
-
10
-
11
-
12
-
13
-
14
-
15
-
16
-
17
-
18
-
19
-
20
-
21
-
22
-
23
-
24
-
25
-
26
-
27
-
28
-
29
-
30
-
31
-
32
-
33
-
34
-
35
-
36
-
37
-
 38
38 -
 39
39 -
 40
40 -
 41
41 -
 42
42 -
 43
43 -
 44
44 -
 45
45 -
 46
46 -
 47
47 -
 48
48 -
 49
49 -
 50
50 -
 51
51 -
 52
52 -
 53
53 -
 54
54 -
 55
55 -
 56
56 -
 57
57 -
 58
58 -
59
-
60
-
61
-
62
-
63
-
64
-
65
-
66
-
67
-
68
-
69
-
70
-
71
-
72
-
73
-
74
-
75
-
76
-
77
-
78
-
79
-
80
-
81
-
82
-
83
-
84
-
85
-
86
-
87
-
88
-
89
-
90
-
91
-
92
-
93
-
94
-
95
-
96
-
97
-
98
-
99
-
100
-
101
-
102
-
103
-
104
-
105
-
106
-
107
-
108
-
109
-
110
-
111
-
112
-
113
-
114
-
115
-
116
-
117
-
118
-
119
-
120
-
121
-
122
-
123
-
124
-
125
-
126
-
127
-
128
-
129
-
130
-
131
-
132
-
133
-
134
-
135
-
136
-
137
-
138
-
139
-
140
-
141
-
142
-
143
-
144
-
145
-
146
-
147
-
148
-
149
-
150
-
151
-
152
-
153
-
154
-
155
-
156
-
157
-
158
-
159
-
160
-
161
-
162
-
163
-
164
-
165
-
166
-
167
-
168
-
169
-
170
-
171
-
172
-
173
-
174
-
175
-
176
-
177
-
178
-
179
-
180
-
181
-
182
-
183
-
184
-
185
-
186
-
187
-
188
-
189
-
190
-
191
-
192
-
193
-
194
-
195
-
196
-
197
-
198
-
199
-
200
-
201
-
202
-
203
-
204
-
205
-
206
-
207
-
208
-
209
-
210
-
211
-
212
-
213
-
214
-
215
-
216
-
217
-
218
-
219
-
220
-
221
-
222
-
223
-
224
-
225
-
226
-
227
-
228
-
229
-
230
-
231
-
232
-
233
-
234
-
235
-
236
-
237
-
238
-
239
-
240
-
241
-
242
-
243
-
244
-
245
-
246
-
247
-
248
-
249
-
250
-
251
-
252
-
253
-
254
-
255
-
256
-
257
-
258
-
259
-
260
-
261
-
262
-
263
-
264
 |
 |

28
PART II
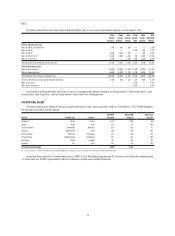
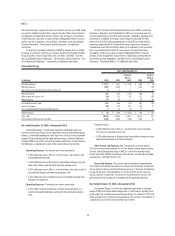
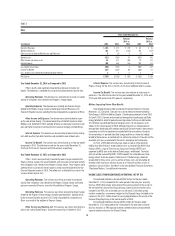
ITEM 6. SELECTED FINANCIAL DATA
(in millions, except per share amounts) 2014(c) 2013(c) 2012(c) 2011(c) 2010(c)
Statement of Operations(a)
Total operating revenues $ 23,925 $ 22,756 $ 17,912 $12,412 $12,220
Operating income 5,258 4,854 2,911 2,475 2,444
Income from continuing operations 2,465 2,590 1,611 1,508 1,481
(Loss) Income From Discontinued Operations, net of tax (576) 86 171 206 (157)
Net income 1,889 2,676 1,782 1,714 1,324
Net income attributable to Duke Energy Corporation 1,883 2,665 1,768 1,706 1,320
Common Stock Data
Income from continuing operations attributable to Duke Energy Corporation common shareholders(b)
Basic $ 3.46 $ 3.64 $ 2.77 $ 3.34 $ 3.34
Diluted 3.46 3.63 2.77 3.34 3.33
(Loss) Income from discontinued operations attributable to Duke Energy Corporation common shareholders
Basic $ (0.80) $ 0.13 $ 0.30 $ 0.49 $ (0.34)
Diluted (0.80) 0.13 0.30 0.49 (0.33)
Net income attributable to Duke Energy Corporation common shareholders(b)
Basic $ 2.66 $ 3.77 $ 3.07 $ 3.83 $ 3.00
Diluted 2.66 3.76 3.07 3.83 3.00
Dividends declared per common share(b) 3.15 3.09 3.03 2.97 2.91
Balance Sheet
Total assets $ 120,709 $114,779 $ 113,856 $62,526 $59,090
Long-term debt including capital leases and redeemable preferred stock of subsidiaries, less current maturities 37,213 38,152 36,444 18,679 17,935
(a) Signifi cant transactions refl ected in the results above include: (i) 2014 impairment of the Disposal Group (see Note 2 to the Consolidated Financial Statements, “Acquisitions, Dispositions and Sales of Other Assets”); (ii)
2014 incremental tax expense resulting from the decision to repatriate all cumulative historical undistributed foreign earnings (see Note 22 to the Consolidated Financial Statements, “Income Taxes”); (iii) 2014 increase in the
litigation reserve related to the criminal investigation of the Dan River coal ash spill (see Note 5 to the Consolidated Financial Statements, “Commitments and Contingencies”); (iv) 2013 charges related to Crystal River Unit 3
and nuclear development costs (see Notes 4 and 25 to the Consolidated Financial Statements, “Regulatory Matters” and “Quarterly Financial Data”, respectively); (v) the 2012 merger with Progress Energy (see Note 2 to the
Consolidated Financial Statements, “Acquisitions, Dispositions and Sales of Other Assets”); (vi) 2012 and 2011 pretax impairment and other charges related to the Edwardsport Integrated Gasifi cation Combined Cycle (IGCC)
project of $628 million and $222 million, respectively; and (vii) 2010 pretax impairment of goodwill and other assets of $660 million.
(b) On July 2, 2012, immediately prior to the merger with Progress Energy, Duke Energy executed a one-for-three reverse stock split. All share and earnings per share amounts are presented as if the one-for-three reverse stock
split had been effective at the beginning of the earliest period presented.
(c) Operating results refl ect reclassifi cations due to the impact of discontinued operations (see Note 2 to the Consolidated Financial Statements, “Acquisitions, Dispositions and Sales of Other Assets”).
ITEM 7. MANAGEMENT’S DISCUSSION AND ANALYSIS OF FINANCIAL CONDITION AND RESULTS OF OPERATIONS
Management’s Discussion and Analysis includes fi nancial information
prepared in accordance with generally accepted accounting principles (GAAP)
in the United States (U.S.), as well as certain non-GAAP fi nancial measures
such as adjusted earnings, adjusted earnings per share and adjusted segment
income, discussed below. Generally, a non-GAAP fi nancial measure is a
numerical measure of fi nancial performance, fi nancial position or cash fl ows
that excludes (or includes) amounts that are included in (or excluded from) the
most directly comparable measure calculated and presented in accordance with
GAAP. The non-GAAP fi nancial measures should be viewed as a supplement to,
and not a substitute for, fi nancial measures presented in accordance with GAAP.
Non-GAAP measures as presented herein may not be comparable to similarly
titled measures used by other companies.
The following combined Management’s Discussion and Analysis of
Financial Condition and Results of Operations is separately fi led by Duke Energy
Corporation (collectively with its subsidiaries, Duke Energy) and its subsidiaries
Duke Energy Carolinas, LLC (Duke Energy Carolinas), Progress Energy, Inc.
(Progress Energy), Duke Energy Progress, Inc. (Duke Energy Progress), Duke
Energy Florida, Inc. (Duke Energy Florida), Duke Energy Ohio, Inc. (Duke Energy
Ohio) and Duke Energy Indiana, Inc. (Duke Energy Indiana) (collectively referred
to as the Subsidiary Registrants). However, none of the registrants makes any
representation as to information related solely to Duke Energy or the Subsidiary
Registrants of Duke Energy other than itself.
DUKE ENERGY
Duke Energy is an energy company headquartered in Charlotte, North
Carolina. Duke Energy operates in the U.S. primarily through its wholly owned
subsidiaries, Duke Energy Carolinas, Duke Energy Progress, Duke Energy Florida,
Duke Energy Ohio, and Duke Energy Indiana, as well as in Latin America.
When discussing Duke Energy’s consolidated fi nancial information, it
necessarily includes the results of the Subsidiary Registrants, which, along with
Duke Energy, are collectively referred to as the Duke Energy Registrants.
Management’s Discussion and Analysis should be read in conjunction
with the Consolidated Financial Statements and Notes for the years ended
December 31, 2014, 2013 and 2012.
Executive Overview
MERGER WITH PROGRESS ENERGY
On July 2, 2012, Duke Energy merged with Progress Energy, with Duke
Energy continuing as the surviving corporation, and Progress Energy becoming
a wholly owned subsidiary of Duke Energy. Duke Energy Progress and Duke
Energy Florida, Progress Energy’s regulated utility subsidiaries, are now indirect
wholly owned subsidiaries of Duke Energy. Duke Energy’s consolidated fi nancial
statements include Progress Energy, Duke Energy Progress and Duke Energy
Florida activity beginning July 2, 2012.
Immediately preceding the merger, Duke Energy completed a one-for-three
reverse stock split with respect to the issued and outstanding shares of Duke
Energy common stock. All share and per share amounts presented herein refl ect
the impact of the one-for-three reverse stock split.
For additional information on the details of this transaction including
regulatory conditions and accounting implications, see Note 2 to the
Consolidated Financial Statements, “Acquisitions, Dispositions and Sales of
Other Assets.”