Duke Energy 2014 Annual Report Download - page 173
Download and view the complete annual report
Please find page 173 of the 2014 Duke Energy annual report below. You can navigate through the pages in the report by either clicking on the pages listed below, or by using the keyword search tool below to find specific information within the annual report.-
 1
1 -
2
-
3
-
4
-
5
-
6
-
7
-
8
-
9
-
10
-
11
-
12
-
13
-
14
-
15
-
16
-
17
-
18
-
19
-
20
-
21
-
22
-
23
-
24
-
25
-
26
-
27
-
28
-
29
-
30
-
31
-
32
-
33
-
34
-
35
-
36
-
37
-
38
-
39
-
40
-
41
-
42
-
43
-
44
-
45
-
46
-
47
-
48
-
49
-
50
-
51
-
52
-
53
-
54
-
55
-
56
-
57
-
58
-
59
-
60
-
61
-
62
-
63
-
64
-
65
-
66
-
67
-
68
-
69
-
70
-
71
-
72
-
73
-
74
-
75
-
76
-
77
-
78
-
79
-
80
-
81
-
82
-
83
-
84
-
85
-
86
-
87
-
88
-
89
-
90
-
91
-
92
-
93
-
94
-
95
-
96
-
97
-
98
-
99
-
100
-
101
-
102
-
103
-
104
-
105
-
106
-
107
-
108
-
109
-
110
-
111
-
112
-
113
-
114
-
115
-
116
-
117
-
118
-
119
-
120
-
121
-
122
-
123
-
124
-
125
-
126
-
127
-
128
-
129
-
130
-
131
-
132
-
133
-
134
-
135
-
136
-
137
-
138
-
139
-
140
-
141
-
142
-
143
-
144
-
145
-
146
-
147
-
148
-
149
-
150
-
151
-
152
-
153
-
154
-
155
-
156
-
157
-
158
-
159
-
160
-
161
-
162
-
 163
163 -
 164
164 -
 165
165 -
 166
166 -
 167
167 -
 168
168 -
 169
169 -
 170
170 -
 171
171 -
 172
172 -
 173
173 -
 174
174 -
 175
175 -
 176
176 -
 177
177 -
 178
178 -
 179
179 -
 180
180 -
 181
181 -
 182
182 -
 183
183 -
184
-
185
-
186
-
187
-
188
-
189
-
190
-
191
-
192
-
193
-
194
-
195
-
196
-
197
-
198
-
199
-
200
-
201
-
202
-
203
-
204
-
205
-
206
-
207
-
208
-
209
-
210
-
211
-
212
-
213
-
214
-
215
-
216
-
217
-
218
-
219
-
220
-
221
-
222
-
223
-
224
-
225
-
226
-
227
-
228
-
229
-
230
-
231
-
232
-
233
-
234
-
235
-
236
-
237
-
238
-
239
-
240
-
241
-
242
-
243
-
244
-
245
-
246
-
247
-
248
-
249
-
250
-
251
-
252
-
253
-
254
-
255
-
256
-
257
-
258
-
259
-
260
-
261
-
262
-
263
-
264
 |
 |

153
PART II
DUKE ENERGY CORPORATION • DUKE ENERGY CAROLINAS, LLC • PROGRESS ENERGY, INC. •
DUKE ENERGY PROGRESS, INC. • DUKE ENERGY FLORIDA, INC. • DUKE ENERGY OHIO, INC. • DUKE ENERGY INDIANA, INC.
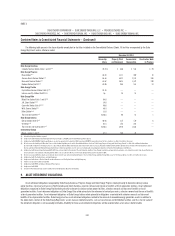
Combined Notes to Consolidated Financial Statements – (Continued)
The following tables show notional amounts for derivatives related to interest rate risk.
December 31, 2014 December 31, 2013
(in millions)
Duke
Energy
Duke
Energy
Florida
Duke
Energy
Ohio
Duke
Energy
Duke Energy
Ohio
Cash fl ow hedges(a) $ 750 $ — $ — $798 $ —
Undesignated contracts 277 250 27 34 27
Total notional amount $1,027 $ 250 $ 27 $ 832 $ 27
(a) Duke Energy includes amounts related to consolidated VIEs of $541 million at December 31, 2014 and $584 million at December 31, 2013.
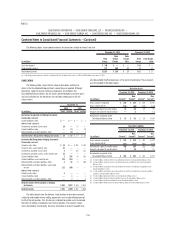
DUKE ENERGY
The following table shows the fair value of derivatives and the line
items in the Consolidated Balance Sheets where they are reported. Although
derivatives subject to master netting arrangements are netted on the
Consolidated Balance Sheets, the fair values presented below are shown gross
and cash collateral on the derivatives has not been netted against the fair
values shown.
December 31,
2014 2013
(in millions) Asset Liability Asset Liability
Derivatives Designated as Hedging Instruments
Commodity contracts
Current liabilities: other $— $— $— $ 1
Interest rate contracts
Investments and other assets: other 10 — 27 —
Current liabilities: other —13—18
Deferred credits and other liabilities: other —29—4
Total Derivatives Designated as Hedging Instruments $ 10 $ 42 $27 $23
Derivatives Not Designated as Hedging Instruments
Commodity contracts
Current assets: other $18 $— $ 201 $ 158
Current assets: assets held for sale 15 — ——
Investments and other assets: other 3—215 131
Investments and other assets: assets held for sale 15 — ——
Current liabilities: other 1 307 13 153
Current liabilities: assets held for sale 174 253 ——
Deferred credits and other liabilities: other 2915 166
Deferred credits and other liabilities: assets held
for sale 111 208 ——
Interest rate contracts
Current assets: other 2———
Current liabilities: other —1—1
Deferred credits and other liabilities: other —7—4
Total Derivatives Not Designated as Hedging
Instruments $ 341 $867 $ 434 $ 613
Total Derivatives $ 351 $909 $ 461 $ 636
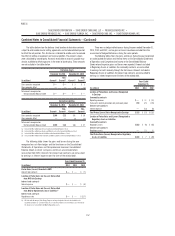
The tables below show the balance sheet location of derivative contracts
subject to enforceable master netting agreements and include collateral posted
to offset the net position. This disclosure is intended to enable users to evaluate
the effect of netting arrangements on fi nancial position. The amounts shown
were calculated by counterparty. Accounts receivable or accounts payable may
also be available to offset exposures in the event of bankruptcy. These amounts
are not included in the tables below.
Derivative Assets
December 31, 2014 December 31, 2013
(in millions) Current(a)
Non-
Current(b) Current(e)
Non-
Current(f)
Gross amounts recognized $ 210 $ 136 $ 214 $ 233
Gross amounts offset (153) (88) (179) (138)
Net amount subject to master netting 57 48 35 95
Amounts not subject to master netting —5—14
Net amounts recognized on the
Consolidated Balance Sheet $57 $53 $ 35 $ 109
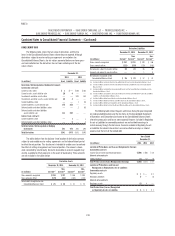
Derivative Liabilities
December 31, 2014 December 31, 2013
(in millions) Current(c)
Non-
Current(d) Current(g)
Non-
Current(h)
Gross amounts recognized $ 573 $ 319 $ 322 $ 299
Gross amounts offset (213) (173) (192) (155)
Net amounts subject to master netting 360 146 130 144
Amounts not subject to master netting 116 411
Net amounts recognized on the
Consolidated Balance Sheet $ 361 $ 162 $ 134 $ 155
(a) Included in Other and Assets Held for Sale within Current Assets on the Consolidated Balance Sheet.
(b) Included in Other and Assets held for Sale within Investments and Other Assets on the Consolidated
Balance Sheet.
(c) Included in Other and Liabilities Associated with Assets Held for Sale within Current Liabilities on the
Consolidated Balance Sheet.
(d) Included in Other and Liabilities Associated with Assets Held for Sale within Deferred Credits and Other
Liabilities on the Consolidated Balance Sheet.
(e) Included in Other within Current Assets on the Consolidated Balance Sheet.
(f) Included in Other within Investments and Other Assets on the Consolidated Balance Sheet.
(g) Included in Other within Current Liabilities on the Consolidated Balance Sheet.
(h) Included in Other within Deferred Credits and Other Liabilities on the Consolidated Balance Sheet.