Duke Energy 2014 Annual Report Download - page 222
Download and view the complete annual report
Please find page 222 of the 2014 Duke Energy annual report below. You can navigate through the pages in the report by either clicking on the pages listed below, or by using the keyword search tool below to find specific information within the annual report.-
 1
1 -
2
-
3
-
4
-
5
-
6
-
7
-
8
-
9
-
10
-
11
-
12
-
13
-
14
-
15
-
16
-
17
-
18
-
19
-
20
-
21
-
22
-
23
-
24
-
25
-
26
-
27
-
28
-
29
-
30
-
31
-
32
-
33
-
34
-
35
-
36
-
37
-
38
-
39
-
40
-
41
-
42
-
43
-
44
-
45
-
46
-
47
-
48
-
49
-
50
-
51
-
52
-
53
-
54
-
55
-
56
-
57
-
58
-
59
-
60
-
61
-
62
-
63
-
64
-
65
-
66
-
67
-
68
-
69
-
70
-
71
-
72
-
73
-
74
-
75
-
76
-
77
-
78
-
79
-
80
-
81
-
82
-
83
-
84
-
85
-
86
-
87
-
88
-
89
-
90
-
91
-
92
-
93
-
94
-
95
-
96
-
97
-
98
-
99
-
100
-
101
-
102
-
103
-
104
-
105
-
106
-
107
-
108
-
109
-
110
-
111
-
112
-
113
-
114
-
115
-
116
-
117
-
118
-
119
-
120
-
121
-
122
-
123
-
124
-
125
-
126
-
127
-
128
-
129
-
130
-
131
-
132
-
133
-
134
-
135
-
136
-
137
-
138
-
139
-
140
-
141
-
142
-
143
-
144
-
145
-
146
-
147
-
148
-
149
-
150
-
151
-
152
-
153
-
154
-
155
-
156
-
157
-
158
-
159
-
160
-
161
-
162
-
163
-
164
-
165
-
166
-
167
-
168
-
169
-
170
-
171
-
172
-
173
-
174
-
175
-
176
-
177
-
178
-
179
-
180
-
181
-
182
-
183
-
184
-
185
-
186
-
187
-
188
-
189
-
190
-
191
-
192
-
193
-
194
-
195
-
196
-
197
-
198
-
199
-
200
-
201
-
202
-
203
-
204
-
205
-
206
-
207
-
208
-
209
-
210
-
211
-
 212
212 -
 213
213 -
 214
214 -
 215
215 -
 216
216 -
 217
217 -
 218
218 -
 219
219 -
 220
220 -
 221
221 -
 222
222 -
 223
223 -
 224
224 -
 225
225 -
 226
226 -
 227
227 -
 228
228 -
 229
229 -
 230
230 -
 231
231 -
 232
232 -
233
-
234
-
235
-
236
-
237
-
238
-
239
-
240
-
241
-
242
-
243
-
244
-
245
-
246
-
247
-
248
-
249
-
250
-
251
-
252
-
253
-
254
-
255
-
256
-
257
-
258
-
259
-
260
-
261
-
262
-
263
-
264
 |
 |

202
PART II
DUKE ENERGY CORPORATION • DUKE ENERGY CAROLINAS, LLC • PROGRESS ENERGY, INC. •
DUKE ENERGY PROGRESS, INC. • DUKE ENERGY FLORIDA, INC. • DUKE ENERGY OHIO, INC. • DUKE ENERGY INDIANA, INC.
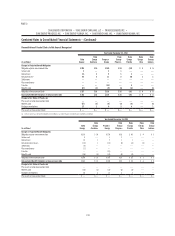
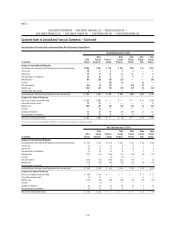
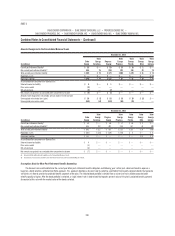
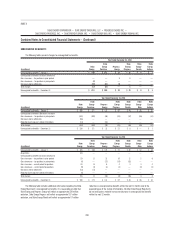
Combined Notes to Consolidated Financial Statements – (Continued)
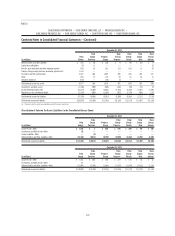
(in millions)
December 31, 2013
Total Fair Value Level 1 Level 2 Level 3
Equity securities $ 2,877 $1,801 $1,022 $ 54
Corporate debt securities 2,604 — 2,601 3
Short-term investment funds 1,158 254 904 —
Partnership interests 307 — — 307
Hedge funds 164 — 111 53
Real estate limited partnerships 95 — — 95
U.S. government securities 927 — 927 —
Guarantees investment contracts 33 — — 33
Governments bonds – foreign 19 — 18 1
Cash 58 58 — —
Asset backed securities 7— 7—
Net pending transactions and other investments 12 7 5 —
Total assets(a) $ 8,261 $2,120 $5,595 $ 546
(a) Duke Energy Carolinas, Progress Energy, Duke Energy Progress, Duke Energy Florida, Duke Energy Ohio and Duke Energy Indiana were allocated approximately 28 percent, 35 percent, 16 percent, 16 percent, 5 percent and
8 percent, respectively, of the Duke Energy Master Retirement Trust assets at December 31, 2013. Accordingly, all Level 1, 2 and 3 amounts included in the table above are allocable to the Subsidiary Registrants using these
percentages.
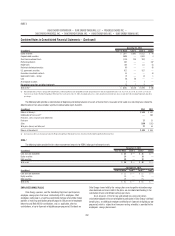
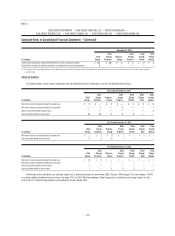
The following table provides a reconciliation of beginning and ending balances of assets of master trusts measured at fair value on a recurring basis where the
determination of fair value includes signifi cant unobservable inputs (Level 3).
(in millions) 2014 2013
Balance at January 1 $ 546 $ 352
Combination of trust assets(a) —288
Purchases, sales, issuances and settlements
Purchases 17 25
Sales (164) (152)
Total gains (losses) and other, net 37 33
Balance at December 31 $ 436 $ 546
(a) As of January 1, 2013, assets previously held in the Progress Energy Master Retirement Trust were transferred into the Duke Energy Master Retirement Trust.
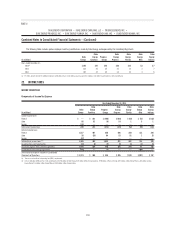
VEBA I
The following tables provide the fair value measurement amounts for VEBA I other post-retirement assets.
December 31, 2014
(in millions) Total Fair Value Level 1 Level 2 Level 3
Cash and cash equivalents $21 $— $21 $—
Equity securities 14 — 14 —
Debt securities 13 — 13 —
Total assets $48 $— $48 $—
December 31, 2013
(in millions) Total Fair Value Level 1 Level 2 Level 3
Cash and cash equivalents $21 $— $21 $—
Equity securities 15 — 15 —
Debt securities 15 — 15 —
Total assets $51 $— $51 $—
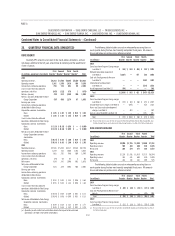
EMPLOYEE SAVINGS PLANS
Duke Energy sponsors, and the Subsidiary Registrants participate in,
employee savings plans that cover substantially all U.S. employees. Most
employees participate in a matching contribution formula where Duke Energy
provides a matching contribution generally equal to 100 percent of employee
before-tax and Roth 401(k) contributions, and, as applicable, after-tax
contributions, of up to 6 percent of eligible pay per pay period. Dividends on
Duke Energy shares held by the savings plans are charged to retained earnings
when declared and shares held in the plans are considered outstanding in the
calculation of basic and diluted earnings per share.
As of January 1, 2014, for new and rehired non-union and certain
unionized employees who are not eligible to participate in Duke Energy’s defi ned
benefi t plans, an additional employer contribution of 4 percent of eligible pay per
pay period, which is subject to a three-year vesting schedule, is provided to the
employee’s savings plan account.