Duke Energy 2014 Annual Report Download - page 136
Download and view the complete annual report
Please find page 136 of the 2014 Duke Energy annual report below. You can navigate through the pages in the report by either clicking on the pages listed below, or by using the keyword search tool below to find specific information within the annual report.-
 1
1 -
2
-
3
-
4
-
5
-
6
-
7
-
8
-
9
-
10
-
11
-
12
-
13
-
14
-
15
-
16
-
17
-
18
-
19
-
20
-
21
-
22
-
23
-
24
-
25
-
26
-
27
-
28
-
29
-
30
-
31
-
32
-
33
-
34
-
35
-
36
-
37
-
38
-
39
-
40
-
41
-
42
-
43
-
44
-
45
-
46
-
47
-
48
-
49
-
50
-
51
-
52
-
53
-
54
-
55
-
56
-
57
-
58
-
59
-
60
-
61
-
62
-
63
-
64
-
65
-
66
-
67
-
68
-
69
-
70
-
71
-
72
-
73
-
74
-
75
-
76
-
77
-
78
-
79
-
80
-
81
-
82
-
83
-
84
-
85
-
86
-
87
-
88
-
89
-
90
-
91
-
92
-
93
-
94
-
95
-
96
-
97
-
98
-
99
-
100
-
101
-
102
-
103
-
104
-
105
-
106
-
107
-
108
-
109
-
110
-
111
-
112
-
113
-
114
-
115
-
116
-
117
-
118
-
119
-
120
-
121
-
122
-
123
-
124
-
125
-
 126
126 -
 127
127 -
 128
128 -
 129
129 -
 130
130 -
 131
131 -
 132
132 -
 133
133 -
 134
134 -
 135
135 -
 136
136 -
 137
137 -
 138
138 -
 139
139 -
 140
140 -
 141
141 -
 142
142 -
 143
143 -
 144
144 -
 145
145 -
 146
146 -
147
-
148
-
149
-
150
-
151
-
152
-
153
-
154
-
155
-
156
-
157
-
158
-
159
-
160
-
161
-
162
-
163
-
164
-
165
-
166
-
167
-
168
-
169
-
170
-
171
-
172
-
173
-
174
-
175
-
176
-
177
-
178
-
179
-
180
-
181
-
182
-
183
-
184
-
185
-
186
-
187
-
188
-
189
-
190
-
191
-
192
-
193
-
194
-
195
-
196
-
197
-
198
-
199
-
200
-
201
-
202
-
203
-
204
-
205
-
206
-
207
-
208
-
209
-
210
-
211
-
212
-
213
-
214
-
215
-
216
-
217
-
218
-
219
-
220
-
221
-
222
-
223
-
224
-
225
-
226
-
227
-
228
-
229
-
230
-
231
-
232
-
233
-
234
-
235
-
236
-
237
-
238
-
239
-
240
-
241
-
242
-
243
-
244
-
245
-
246
-
247
-
248
-
249
-
250
-
251
-
252
-
253
-
254
-
255
-
256
-
257
-
258
-
259
-
260
-
261
-
262
-
263
-
264
 |
 |

116
PART II
DUKE ENERGY CORPORATION • DUKE ENERGY CAROLINAS, LLC • PROGRESS ENERGY, INC. •
DUKE ENERGY PROGRESS, INC. • DUKE ENERGY FLORIDA, INC. • DUKE ENERGY OHIO, INC. • DUKE ENERGY INDIANA, INC.
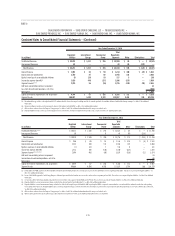
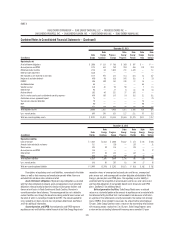
Combined Notes to Consolidated Financial Statements – (Continued)
Year Ended December 31, 2012
(in millions)
Regulated
Utilities
International
Energy
Commercial
Power
Reportable
Segments Other Eliminations Total
Unaffi liated Revenues $ 16,042 $ 1,549 $ 299 $ 17,890 $ 22 $ — $ 17,912
Intersegment Revenues 38 —8 46 62 (108) —
Total Revenues $ 16,080 $ 1,549 $ 307 $ 17,936 $ 84 $ (108) $ 17,912
Interest Expense $ 806 $ 77 $ 63 $ 946 $ 298 $ — $ 1,244
Depreciation and amortization 1,827 99 85 2,011 134 — 2,145
Equity in earnings of unconsolidated affi liates (5) 134 14 143 5 — 148
Income tax expense (benefi t) 942 149 (82) 1,009 (386) — 623
Segment income(a)(b) 1,744 439 (59) 2,124 (523) (8) 1,593
Add back noncontrolling interest component 18
Income from discontinued operations, net of tax 171
Net income $ 1,782
Capital investments expenditures and acquisitions $ 4,220 $ 551 $ 1,038 $ 5,809 $ 149 $ — $ 5,958
Segment Assets 98,162 5,406 6,992 110,560 3,126 170 113,856
(a) Regulated Utilities recorded charges related to Duke Energy Indiana’s Integrated Gasifi cation Combined Cycle (IGCC) project. See Note 4 for additional information about these charges. Regulated Utilities also recorded the
reversal of expenses of $60 million, net of tax, related to a prior year Voluntary Opportunity Plan in accordance with Duke Energy Carolinas’ 2011 rate case. See Note 19 for additional information about these expenses.
(b) Other includes costs to achieve the Progress Energy merger. See Notes 2 and 25 for additional information about the merger and related costs.
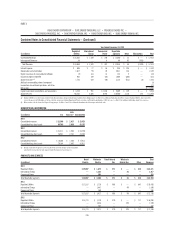
GEOGRAPHICAL INFORMATION
(in millions) U.S.
Latin
America(a) Consolidated
2014
Consolidated revenues $ 22,508 $ 1,417 $ 23,925
Consolidated long-lived assets 80,709 2,458 83,167
2013
Consolidated revenues $ 21,211 $ 1,545 $ 22,756
Consolidated long-lived assets 78,581 2,781 81,362
2012
Consolidated revenues $ 16,366 $ 1,546 $ 17,912
Consolidated long-lived assets 79,144 2,467 81,611
(a) Change in amounts of long-lived assets in Latin America includes foreign currency translation
adjustments on property, plant and equipment and other long-lived asset balances.
PRODUCTS AND SERVICES
(in millions)
Retail
Electric
Wholesale
Electric
Retail Natural
Gas
Wholesale
Natural Gas Other
Total
Revenues
2014
Regulated Utilities $ 19,007 $ 1,879 $ 571 $ — $ 814 $ 22,271
International Energy — 1,326 — 91 — 1,417
Commercial Power — 255 — — — 255
Total Reportable Segments $ 19,007 $ 3,460 $ 571 $ 91 $ 814 $ 23,943
2013
Regulated Utilities $ 17,837 $ 1,720 $ 506 $ — $ 847 $ 20,910
International Energy — 1,447 — 99 — 1,546
Commercial Power — 260 — — — 260
Total Reportable Segments $ 17,837 $ 3,427 $ 506 $ 99 $ 847 $ 22,716
2012
Regulated Utilities $ 13,773 $ 1,120 $ 470 $ — $ 717 $ 16,080
International Energy — 1,444 — 105 — 1,549
Commercial Power — 307 — — — 307
Total Reportable Segments $ 13,773 $ 2,871 $ 470 $ 105 $ 717 $ 17,936