Duke Energy 2014 Annual Report Download - page 140
Download and view the complete annual report
Please find page 140 of the 2014 Duke Energy annual report below. You can navigate through the pages in the report by either clicking on the pages listed below, or by using the keyword search tool below to find specific information within the annual report.-
 1
1 -
2
-
3
-
4
-
5
-
6
-
7
-
8
-
9
-
10
-
11
-
12
-
13
-
14
-
15
-
16
-
17
-
18
-
19
-
20
-
21
-
22
-
23
-
24
-
25
-
26
-
27
-
28
-
29
-
30
-
31
-
32
-
33
-
34
-
35
-
36
-
37
-
38
-
39
-
40
-
41
-
42
-
43
-
44
-
45
-
46
-
47
-
48
-
49
-
50
-
51
-
52
-
53
-
54
-
55
-
56
-
57
-
58
-
59
-
60
-
61
-
62
-
63
-
64
-
65
-
66
-
67
-
68
-
69
-
70
-
71
-
72
-
73
-
74
-
75
-
76
-
77
-
78
-
79
-
80
-
81
-
82
-
83
-
84
-
85
-
86
-
87
-
88
-
89
-
90
-
91
-
92
-
93
-
94
-
95
-
96
-
97
-
98
-
99
-
100
-
101
-
102
-
103
-
104
-
105
-
106
-
107
-
108
-
109
-
110
-
111
-
112
-
113
-
114
-
115
-
116
-
117
-
118
-
119
-
120
-
121
-
122
-
123
-
124
-
125
-
126
-
127
-
128
-
129
-
 130
130 -
 131
131 -
 132
132 -
 133
133 -
 134
134 -
 135
135 -
 136
136 -
 137
137 -
 138
138 -
 139
139 -
 140
140 -
 141
141 -
 142
142 -
 143
143 -
 144
144 -
 145
145 -
 146
146 -
 147
147 -
 148
148 -
 149
149 -
 150
150 -
151
-
152
-
153
-
154
-
155
-
156
-
157
-
158
-
159
-
160
-
161
-
162
-
163
-
164
-
165
-
166
-
167
-
168
-
169
-
170
-
171
-
172
-
173
-
174
-
175
-
176
-
177
-
178
-
179
-
180
-
181
-
182
-
183
-
184
-
185
-
186
-
187
-
188
-
189
-
190
-
191
-
192
-
193
-
194
-
195
-
196
-
197
-
198
-
199
-
200
-
201
-
202
-
203
-
204
-
205
-
206
-
207
-
208
-
209
-
210
-
211
-
212
-
213
-
214
-
215
-
216
-
217
-
218
-
219
-
220
-
221
-
222
-
223
-
224
-
225
-
226
-
227
-
228
-
229
-
230
-
231
-
232
-
233
-
234
-
235
-
236
-
237
-
238
-
239
-
240
-
241
-
242
-
243
-
244
-
245
-
246
-
247
-
248
-
249
-
250
-
251
-
252
-
253
-
254
-
255
-
256
-
257
-
258
-
259
-
260
-
261
-
262
-
263
-
264
 |
 |

120
PART II
DUKE ENERGY CORPORATION • DUKE ENERGY CAROLINAS, LLC • PROGRESS ENERGY, INC. •
DUKE ENERGY PROGRESS, INC. • DUKE ENERGY FLORIDA, INC. • DUKE ENERGY OHIO, INC. • DUKE ENERGY INDIANA, INC.
Combined Notes to Consolidated Financial Statements – (Continued)
December 31, 2013
(in millions)
Duke
Energy
Duke
Energy
Carolinas
Progress
Energy
Duke
Energy
Progress
Duke
Energy
Florida
Duke
Energy
Ohio
Duke
Energy
Indiana
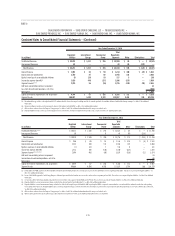
Regulatory Assets
Asset retirement obligations $ 1,608 $ 123 $ 786 $ 389 $ 397 $ — $ —
Accrued pension and OPEB 1,723 347 750 269 438 120 219
Retired generation facilities 1,748 68 1,619 241 1,378 — 61
Debt fair value adjustment 1,338 — — — — — —
Net regulatory asset related to income taxes 1,115 555 331 113 218 72 157
Hedge costs and other deferrals 450 98 318 165 153 5 29
DSM/EE 306 140 152 140 12 14 —
Grid Modernization 65 — — — — 65 —
Vacation accrual 210 82 55 50 — 7 13
Deferred fuel 94 — 37 6 31 14 43
Nuclear deferral 262 40 222 77 145 — —
Post in-service carrying costs and deferred operating expenses 459 150 137 19 118 21 151
Gasifi cation services agreement buyout 75 — — — — — 75
Transmission expansion obligation 70 — — — — 74 —
MGP 90 — — — — 90 —
Other 473 219 101 42 60 46 87
Total regulatory assets 10,086 1,822 4,508 1,511 2,950 528 835
Less: current portion 895 295 353 127 221 57 118
Total non-current regulatory assets $ 9,191 $1,527 $4,155 $ 1,384 $2,729 $ 471 $717
December 31, 2013
(in millions)
Duke
Energy
Duke
Energy
Carolinas
Progress
Energy
Duke
Energy
Progress
Duke
Energy
Florida
Duke
Energy
Ohio
Duke
Energy
Indiana
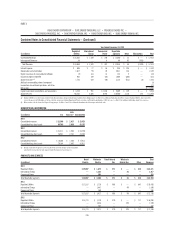
Regulatory Liabilities
Costs of removal $ 5,308 $2,423 $ 2,008 $1,637 $ 371 $ 241 $ 645
Amounts to be refunded to customers 151 — 120 — 120 — 31
Storm reserve 145 20 125 — 125 — —
Accrued pension and OPEB 138 — — — — 21 77
Deferred fuel 177 45 132 — 132 — —
Other 346 153 114 99 14 27 45
Total regulatory liabilities 6,265 2,641 2,499 1,736 762 289 798
Less: current portion 316 65 207 63 144 27 16
Total non-current regulatory liabilities $ 5,949 $2,576 $ 2,292 $1,673 $ 618 $ 262 $ 782
Descriptions of regulatory assets and liabilities, summarized in the tables
above, as well as their recovery and amortization periods follow. Items are
excluded from rate base unless otherwise noted.
Asset retirement obligations. Represents legal obligations associated
with the future retirement of property, plant and equipment. Asset retirement
obligations relate primarily to decommissioning nuclear power facilities and
closure of ash basins in North Carolina and South Carolina. No return is
currently earned on these balances. The recovery period for costs related to
nuclear facilities runs through the decommissioning period of each nuclear unit,
the latest of which is currently estimated to be 2097. The recovery period for
costs related to ash basin closures has not yet been determined. See Notes 1
and 9 for additional information.
Accrued pension and OPEB. Accrued pension and OPEB represent
regulatory assets and liabilities related to each of the Duke Energy Registrants’
respective shares of unrecognized actuarial gains and losses, unrecognized
prior service cost, and unrecognized transition obligation attributable to Duke
Energy’s pension plans and OPEB plans. The regulatory asset or liability is
amortized with the recognition of actuarial gains and losses, prior service cost,
and transition obligations to net periodic benefi t costs for pension and OPEB
plans. See Note 21 for additional detail.
Retired generation facilities. Duke Energy Florida earns a reduced
return on a substantial portion of the amount of regulatory asset associated with
the retirement of Crystal River Unit 3 not included in rate base and a full return
on a portion of the retired plant currently recovered in the nuclear cost recovery
clause (NCRC). Once included in base rates the amount will be amortized over
20 years. Duke Energy Carolinas earns a return on the outstanding retail balance
with recovery periods ranging from 5 to 10 years. Duke Energy Progress earns
a return on the outstanding balance with recovery over a period of 10 years